. 2016 Aug 9;113(32):8991-6.
doi: 10.1073/pnas.1607500113. Epub 2016 Jul 25.

Computational investigation of cold denaturation in the Trp-cage miniprotein

Affiliations

Computational investigation of cold denaturation in the Trp-cage miniprotein

Sang Beom Kim et al. Proc Natl Acad Sci U S A. .

Abstract

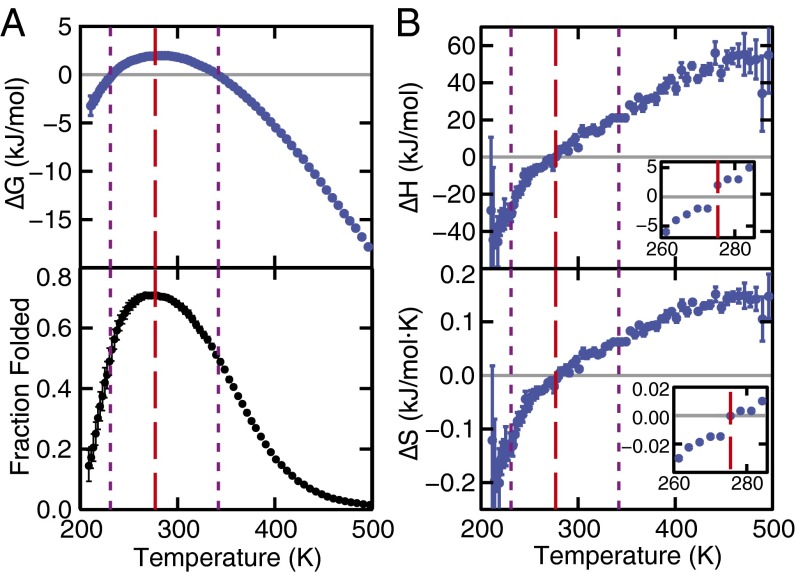
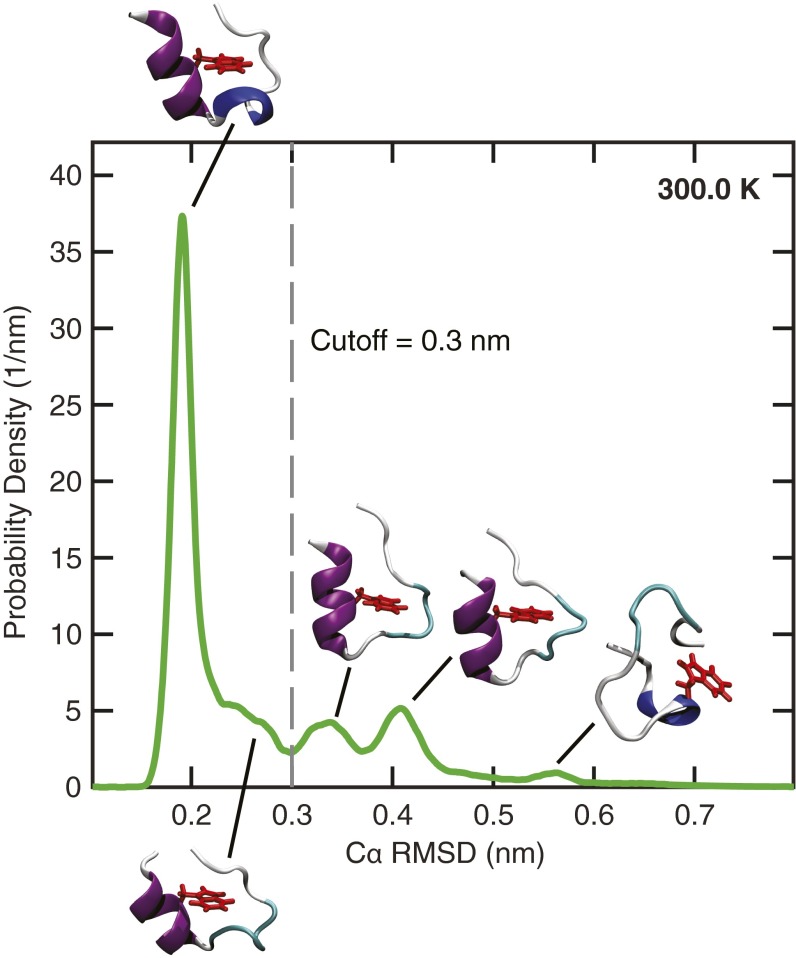
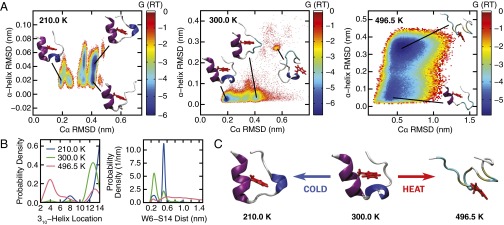
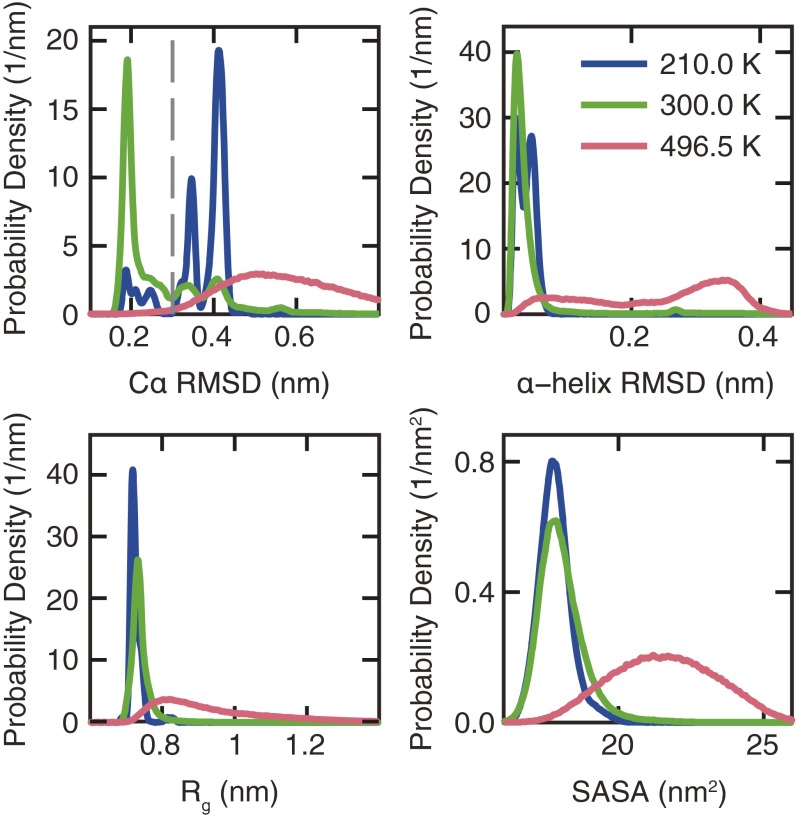
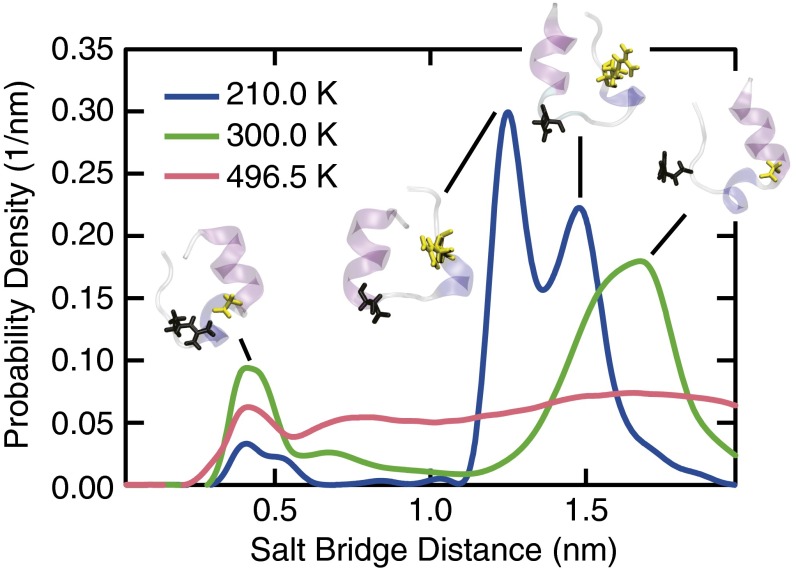
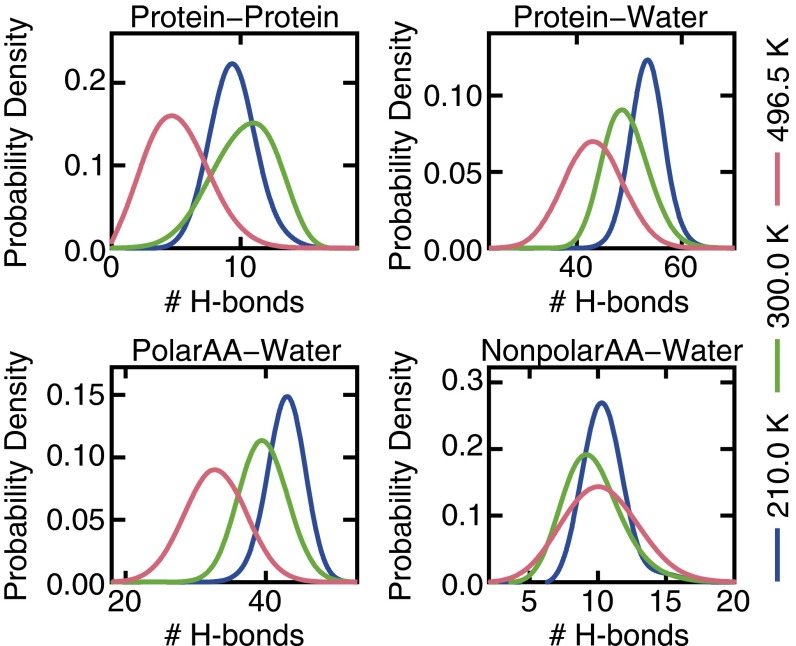
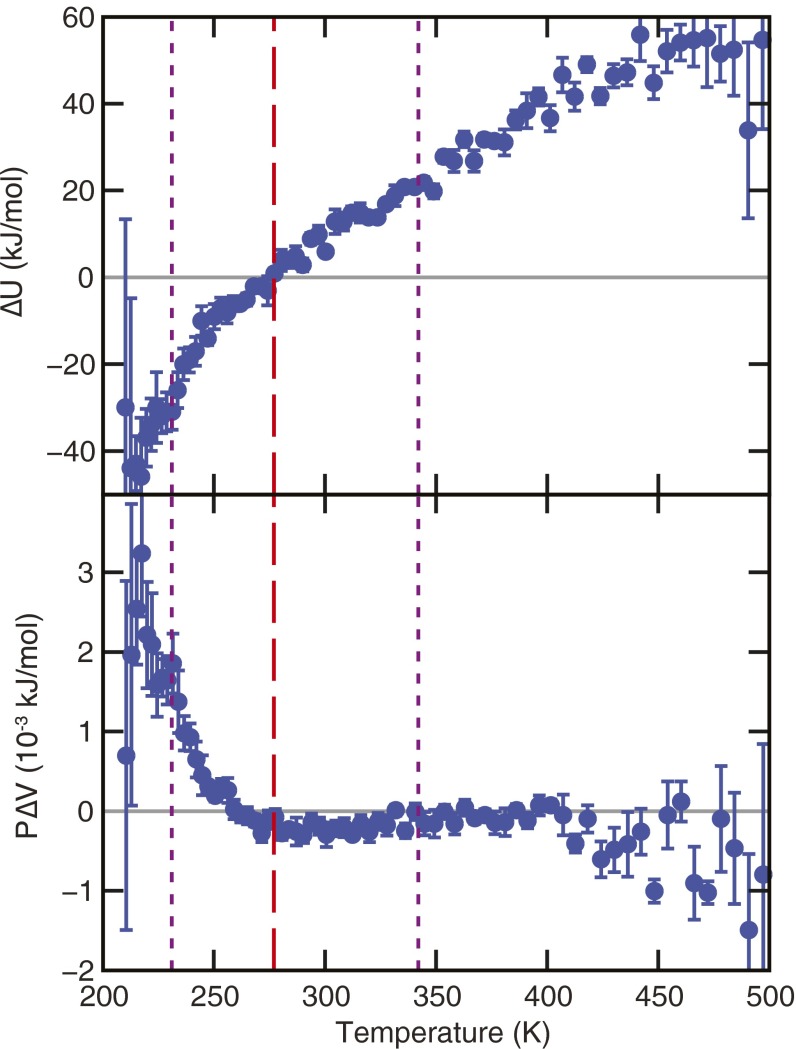
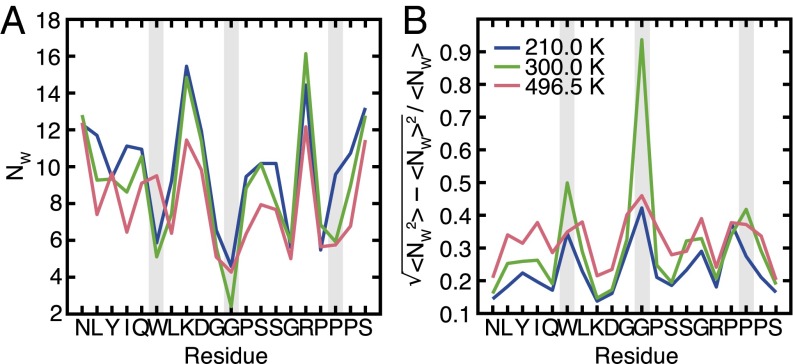
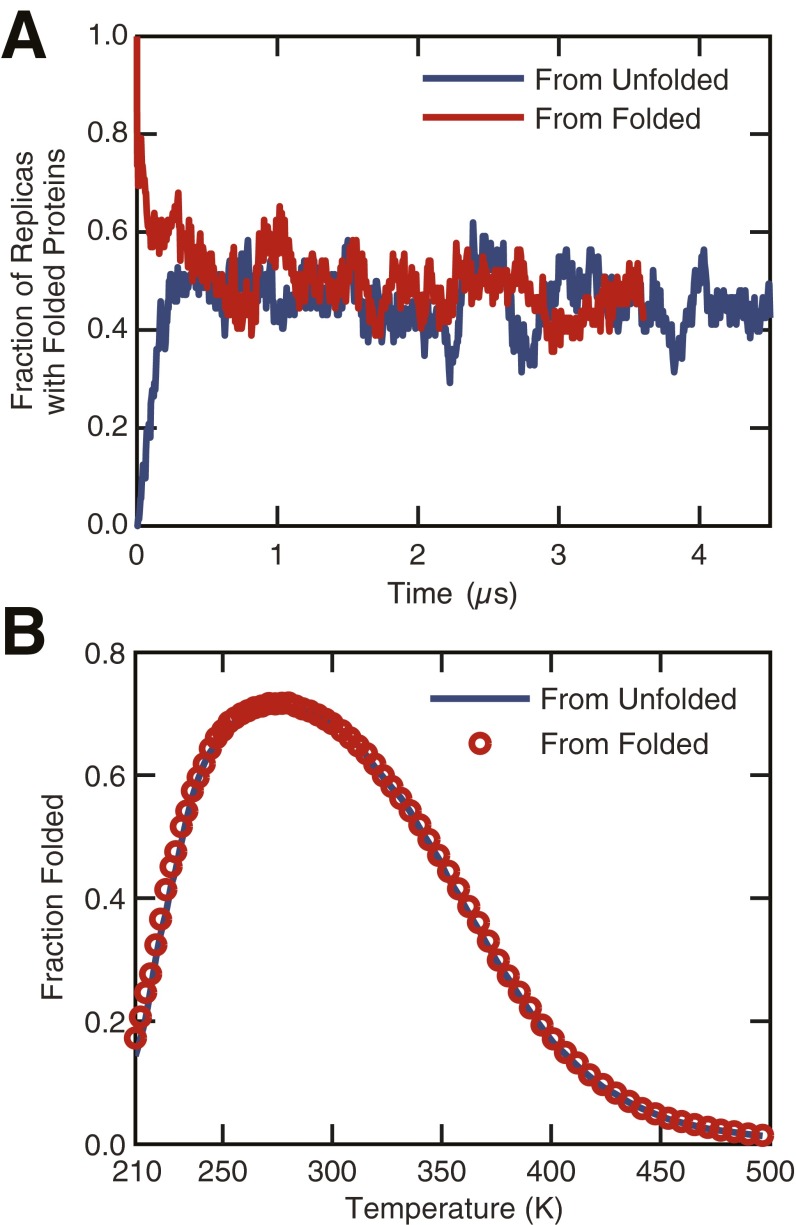
The functional native states of globular proteins become unstable at low temperatures, resulting in cold unfolding and impairment of normal biological function. Fundamental understanding of this phenomenon is essential to rationalizing the evolution of freeze-tolerant organisms and developing improved strategies for long-term preservation of biological materials. We present fully atomistic simulations of cold denaturation of an α-helical protein, the widely studied Trp-cage miniprotein. In contrast to the significant destabilization of the folded structure at high temperatures, Trp-cage cold denatures at 210 K into a compact, partially folded state; major elements of the secondary structure, including the α-helix, are conserved, but the salt bridge between aspartic acid and arginine is lost. The stability of Trp-cage's α-helix at low temperatures suggests a possible evolutionary explanation for the prevalence of such structures in antifreeze peptides produced by cold-weather species, such as Arctic char. Although the 310-helix is observed at cold conditions, its position is shifted toward Trp-cage's C-terminus. This shift is accompanied by intrusion of water into Trp-cage's interior and the hydration of buried hydrophobic residues. However, our calculations also show that the dominant contribution to the favorable energetics of low-temperature unfolding of Trp-cage comes from the hydration of hydrophilic residues.

Keywords: Trp-cage miniprotein; cold denaturation; protein folding.


Conflict of interest statement

The authors declare no conflict of interest.

Figures

Fig. 1.
Fig. 1.
(A) The unfolding free-energy change (Upper) and the fraction of folded proteins (Lower) as a function of temperature. (B) The corresponding enthalpy and entropy changes. The temperature at which the fold fraction is a maximum is 277 K (red dashed line), and the melting and cold unfolding temperatures (x = 0.5, purple dotted lines) are located at 231 K and 342 K, respectively. Error bars are explicitly shown or are smaller than the symbols. See Materials and Methods for error calculation.
Fig. S1.
Fig. S1.
Probability distribution of the Cα rmsd at 300 K. A cut-off of 0.3 nm was chosen to distinguish between the folded and unfolded configurations. The protein structures show representative configurations at the peaks of the probability distribution. Trp-cage’s α-helix, 310-helix, and aromatic side chain on residue W6 are rendered in purple, blue, and red, respectively.
Fig. 2.
Fig. 2.
(A) The free-energy surface (reported in units of RT) associated with the order parameters Cα rmsd and α-helix rmsd at 210, 300, and 496.5 K. The protein structures show representative configurations for selected basins identified on the free-energy surface. (B) Probability distribution of the location of Trp-cage’s three-residue-long 310-helix structure (Left). The number reported on the abscissa denotes the residue on which the 310-helix is centered. The discrete distributions are represented using a continuous spline function for visual clarity. The most probable location of Trp-cage’s 310-helix shifts from residue 12–14 as the Trp-cage cold denatures. (Right) Distance between residues W6 and S14. As the Trp-cage cold denatures at 210 K, the separation between W6 and S14 widens. (C) Representative protein configurations from the most populated states at 210, 300, and 496.5 K. Trp-cage’s α-helix, 310-helix, and aromatic side chain on residue W6 are rendered in purple, blue, and red, respectively.
Fig. S2.
Fig. S2.
Probability distribution of Cα rmsd, α-helix rmsd, Rg, and SASA. The gray dashed line shows the cut-off value of the Cα rmsd (0.3 nm) that was used to define the folded state.
Fig. 3.
Fig. 3.
Probability distribution of the distance between salt bridge-forming residues D9 and R16. The protein structures show representative configurations from the two most populated states, highlighting the position of the two salt bridge-forming residues (D9, black; R16, yellow).
Fig. 4.
Fig. 4.
(Upper) Probability distribution of the number of protein–protein and protein–water H-bonds. (Lower) Probability distribution of the number of H-bonds formed between water and polar amino acids (PolarAA), and between water and nonpolar amino acids (NonpolarAA) in Trp-cage.
Fig. S3.
Fig. S3.
Changes in the internal energy (Upper) and pressure volume (Lower) as the Trp-cage unfolds. The temperature of the maximum fraction folded is at 277 K (red dashed line), and the hot and cold melting temperatures (purple, dotted lines) are located at 231 K and 342 K, respectively.
Fig. 5.
Fig. 5.
(A) Average number of water molecules within 0.4 nm of each residue. (B) Normalized fluctuation in the number of water molecules near each residue, a measure of residue effective hydrophobicity. The gray bars highlight the location of residues W6, G11, and P18, which exhibit a significant reduction in their effective hydrophobicity upon cooling to 210 K.
Fig. S4.
Fig. S4.
Fraction of folded proteins computed from two independent sets of REMD simulations. The first set of REMD simulations was initialized from a thermally unfolded Trp-cage structure, whereas a configuration from the folded state was used to initiate the second set. (A) The fraction of replicas with folded proteins computed as a function of time shows convergence of the two REMD simulations after ∼0.5 µs. (B) The fraction folded distributions computed from the REMD simulations after discarding the first 1.5 µs of each trajectory are indistinguishable, thus confirming that equilibrium has been reached.

Similar articles

Cited by

References

    1. Tanford C. Protein denaturation. Adv Protein Chem. 1968;23:121–282. - PubMed
    1. Zhang J, Peng X, Jonas A, Jonas J. NMR study of the cold, heat, and pressure unfolding of ribonuclease A. Biochemistry. 1995;34(27):8631–8641. - PubMed
    1. Privalov PL. Stability of proteins: Small globular proteins. Adv Protein Chem. 1979;33:167–241. - PubMed
    1. Vajpai N, Nisius L, Wiktor M, Grzesiek S. High-pressure NMR reveals close similarity between cold and alcohol protein denaturation in ubiquitin. Proc Natl Acad Sci USA. 2013;110(5):E368–E376. - PMC - PubMed
    1. Pastore A, et al. Unbiased cold denaturation: Low- and high-temperature unfolding of yeast frataxin under physiological conditions. J Am Chem Soc. 2007;129(17):5374–5375. - PMC - PubMed

Publication types

LinkOut - more resources