. 2016 Sep 9;291(37):19299-311.
doi: 10.1074/jbc.M115.686683. Epub 2016 Jul 25.

Mycotoxin Patulin Suppresses Innate Immune Responses by Mitochondrial Dysfunction and p62/Sequestosome-1-dependent Mitophagy

Affiliations

Mycotoxin Patulin Suppresses Innate Immune Responses by Mitochondrial Dysfunction and p62/Sequestosome-1-dependent Mitophagy

Wan-Ting Tsai et al. J Biol Chem. .

Abstract

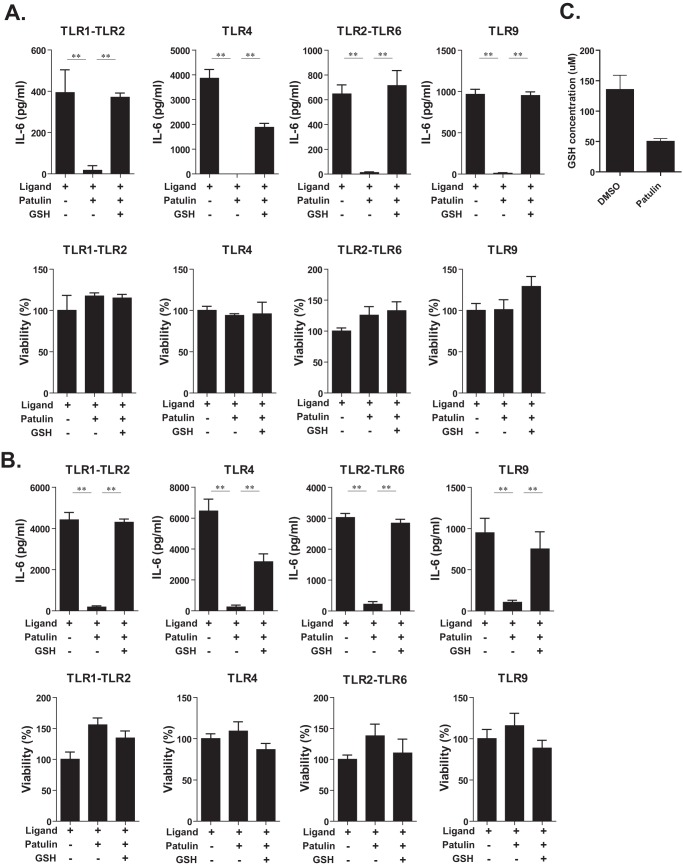
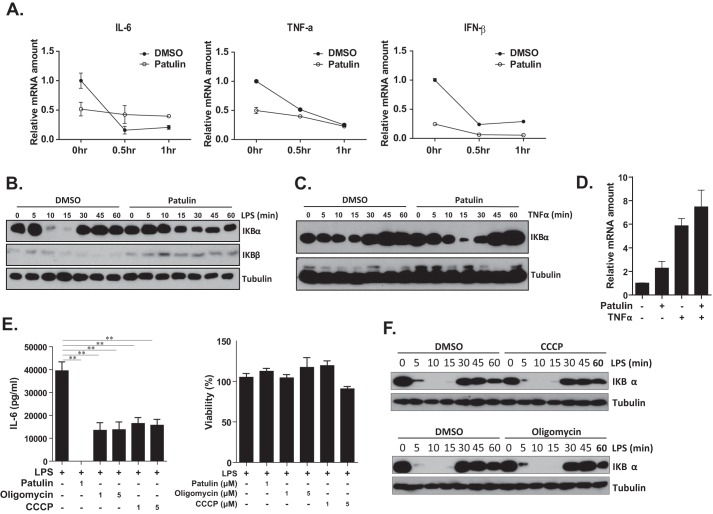
Innate immune responses are important for pathogen elimination and adaptive immune response activation. However, excess inflammation may contribute to immunopathology and disease progression (e.g. inflammation-associated hepatocellular carcinoma). Immune modulation resulting from pattern recognition receptor-induced responses is a potential strategy for controlling immunopathology and related diseases. This study demonstrates that the mycotoxin patulin suppresses Toll-like receptor- and RIG-I/MAVS-dependent cytokine production through GSH depletion, mitochondrial dysfunction, the activation of p62-associated mitophagy, and p62-TRAF6 interaction. Blockade of autophagy restored the immunosuppressive activity of patulin, and pharmacological activation of p62-dependent mitophagy directly reduced RIG-I-like receptor-dependent inflammatory cytokine production. These results demonstrated that p62-dependent mitophagy has an immunosuppressive role to innate immune response and might serve as a potential immunomodulatory target for inflammation-associated diseases.

Keywords: RIG-I-like receptor (RLR); immunomodulation; mitochondria; mitophagy; mycotoxin; p62 (sequestosome 1(SQSTM1)); patulin; toll-like receptor (TLR).


Figures

FIGURE 1.
FIGURE 1.
Patulin blocked LPS-dependent cytokine secretion and NO production. A, mouse leukemic monocyte macrophages (RAW264.7 cells) were treated with various concentrations of patulin in the presence or absence of LPS (1 μg/ml) for 24 h (n = 3). IL-6 and NO levels in culture supernatants were measured by ELISA and the Griess reaction, respectively. Cell viability was determined using the MTT assay. B, cytokine mRNA expression profiles of cells 2 h after LPS treatment (100 ng/ml) were evaluated by quantitative RT-PCR (n = 3). C, cytokine production after 24-h LPS treatment (100 ng/ml) was measured by ELISA (n = 6). D, to stimulate inflammasome activity, J774A.1 cells pretreated with or without LPS (500 ng/ml) for 4 h were stimulated with 5 mm ATP for 30 min. The cells were then washed with PBS and incubated in low serum medium for an additional 4 h. Intracellular (immature) and extracellular (mature) forms of IL-1β and caspase-1 were monitored by immunoblotting. The statistical significance was evaluated by Student's t test. *, p < 0.05; **, p < 0.01. Error bars, S.E.
FIGURE 2.
FIGURE 2.
Patulin blocked IL-6 production induced by other TLR ligands. A, RAW264.7 cells were pretreated with patulin (1 μm) in combination with GSH (1 mm) for 2 h and then stimulated with various TLR ligands for 16 h in the presence of patulin and GSH (n = 6). Pam3CSK4 (0.2 μg/ml), LPS (0.1 μg/ml), FSL1 (10 ng/ml), or ODN1862 (0.1 μg/ml) were used as TLR1-TLR2, TLR4, TLR2-TLR6, and TLR9 ligands, respectively. B, peritoneal macrophages harvested from thioglycollate-stimulated C57BL/6 mice were treated as described in A (n = 6). C, total GSH level in cell lysate prepared from RAW264.7 cells treated with patulin (1 μm) or DMSO (vehicle control) for 8 h was measured (n = 3). Error bars, S.E.
FIGURE 3.
FIGURE 3.
NF-κB activation suppression and mitochondrial dysfunction may contribute to immunosuppressive activity of patulin. A, RAW264.7 cells were treated with patulin (1 μm or DMSO control) for 2 h and then exposed to LPS (100 ng/ml) for 30 min. Cells were then exposed to actinomycin D (Act D; 10 μg/ml) to block de novo mRNA transcription. Cells were then collected at various time points after actinomycin D treatment, and proinflammatory cytokine mRNA in treated cells was quantified using quantitative RT-PCR. B, RAW264.7 cells were pretreated with patulin (1 μm) or DMSO for 2 h and stimulated with LPS (100 ng/ml). Treated cells were collected at different time points post-LPS stimulation and subjected to immunoblotting with anti-IκBα and anti-tubulin antibodies. C, mouse TNFα (10 ng/ml) treatment was used to replace LPS stimulation as described in B. D, RAW264.7 cells were treated with patulin (or DMSO) for 2 h and then exposed to TNFα (10 ng/ml) for 6 h, and IL-6 mRNA expression was measured by quantitative RT-PCR. E, the effects of mitochondrial inhibitors, CCCP and oligomycin, on LPS-dependent IL-6 production were evaluated in RAW264.7 in parallel with patulin treatment (n = 6). F, CCCP and oligomycin (1 μm) were used to replace patulin for pretreatment before LPS stimulation as described in B. Error bars, S.E.
FIGURE 4.
FIGURE 4.
Patulin induced p62 expression and mitophagy activation. A, RAW264.7 cells were pretreated with patulin (or DMSO) in combination with GSH (1 mm) for 2 h and exposed to LPS for 4 h. The expression of the p62 autophagy marker was evaluated by quantitative RT-PCR (n = 3). B, p62 protein expression was examined by immunoblotting with specific antibodies. C, RAW264.7 cells were treated with patulin for 8 h and subjected to mitochondrial fractionation. p62, AIP, and tubulin protein expression in cytosolic and mitochondrial fractions were evaluated by immunoblotting. D, autophagy inhibitor 3-MA was used in combination with patulin in LPS-stimulated RAW264.7 cells (n = 6). E, RAW264.7 cells were exposed to patulin (1 μm), CCCP (5 μm), oligomycin (5 μm), or patulin (1 μm) in combination with 3-MA (10 μm). p62 protein expression was examined by immunoblotting. Error bars, S.E.
FIGURE 5.
FIGURE 5.
Patulin and LPS treatment induced p62-containing complex formation. A, RAW264.7 cells were exposed to patulin for 8 h and stained with Mitotracker dye and an anti-p62 antibody. Stained cells were examined by confocal microscopy. B, RAW264.7 cells exposed to patulin were stained for p62 and the mitochondrial marker AIF with specific antibodies, and the nuclei were counterstained with DAPI. The line plot quantifications of p62, AIF, and DAPI fluorescent intensities of individual cells were analyzed. C, p62-GFP- or GFP-expressing RAW264.7 cells were stimulated with LPS (100 ng/ml) or patulin (1 μm) for 8 h and stained with Mitotracker and DAPI to locate mitochondria and nuclei. The images were obtained by fluorescence microscopy.
FIGURE 6.
FIGURE 6.
Patulin enhanced Nrf2 accumulation and p62-TRAF6 interaction. A, after patulin and LPS (100 ng/ml) treatment (16 h), RAW264.7 cells were lysed and separated into soluble and insoluble fractions. Nrf2 expression was examined by immunoblotting. B, 293T cells were transfected with plasmids to introduce p62-GFP and Myc-tagged TRAF6 expression for 48 h and further treated with patulin (1 μm) for 8 h. MG132 (10 μm) was added at 4 h before cell harvest. p62-TRAF6 interaction was evaluated by co-immunoprecipitation (IP). ←, exogenous p62-GFP; ◀, endogenous p62. C, patulin-pretreated RAW264.7 cells were stimulated with LPS for 6 h and with MG132 for 4 h. p62-TRAF6 interaction was evaluated by co-immunoprecipitation. D, RAW264.7 cells were pretreated with PMI (2–50 μm) for 2 h and then stimulated with various LPS (100 ng/ml) for 16 h in the presence of PMI (n = 6). IL-6 concentration, mitochondrial metabolic activity, and cytotoxicity were measured by an ELISA, an MTT assay, and a lactate dehydrogenase-releasing assay. Ub, ubiquitin. Error bars, S.E.
FIGURE 7.
FIGURE 7.
Patulin blocked RLR-dependent IL-6 production. A, human hepatocyte HeHepLxHT cells were infected with recombinant adenovirus Ad-del to drive hepatitis C virus RdRp active mutant expression with Ad-GFP as control. FLAG-tagged RdRp expression in cells infected for 16 h was detected by immunoblotting with anti-FLAG antibody (left). RdRp-dependent IL-6 production in the presence or absence of patulin treatment (1 μm) was measured by ELISA (n = 6). B, RdRp-dependent IL-6 induction in NeHepLxHT cells was evaluated in the presence of patulin (1 μm) and in combination with GSH (1 mm) (n = 6). C, the expression of the autophagy marker p62 in recombinant adenovirus-infected NeHepLxHT was evaluated by immunoblotting with specific antibodies. D, IL-6 induction of Ad-del-infected NeHepLxHT cells in the presence of patulin (1 μm) and 3-MA (10, 50, or 100 μm) was measured by ELISA (n = 3). p62, FLAG-tagged RdRp, GFP, and tubulin were detected by immunoblotting. E, HeHepLxHT cells were infected with Ad-del and treated with patulin (1 μm) or PMI (2, 10, or 50 μm). IL-6 production in the culture medium was measured by ELISA (n = 6). p62, FLAG-tagged RdRp, GFP, and tubulin expression in the infected cells at 16 h after infection were detected by immunoblotting (left). Error bars, S.E.
FIGURE 8.
FIGURE 8.
Patulin disturbed TLR- and RLR-dependent cytokine production.

Similar articles

Cited by

References

    1. Iwasaki A., and Medzhitov R. (2015) Control of adaptive immunity by the innate immune system. Nat. Immunol. 16, 343–353 - PMC - PubMed
    1. Takeuchi O., and Akira S. (2010) Pattern recognition receptors and inflammation. Cell 140, 805–820 - PubMed
    1. Fukata M., and Abreu M. T. (2008) Role of Toll-like receptors in gastrointestinal malignancies. Oncogene 27, 234–243 - PMC - PubMed
    1. Castello G., Scala S., Palmieri G., Curley S. A., and Izzo F. (2010) HCV-related hepatocellular carcinoma: from chronic inflammation to cancer. Clin. Immunol. 134, 237–250 - PubMed
    1. Horner S. M., and Gale M. Jr. (2013) Regulation of hepatic innate immunity by hepatitis C virus. Nat. Med. 19, 879–888 - PMC - PubMed

LinkOut - more resources