. 2016 Sep 16;291(38):20270-20282.
doi: 10.1074/jbc.M116.744995. Epub 2016 Jul 25.

Structural Basis of Host Autophagy-related Protein 8 (ATG8) Binding by the Irish Potato Famine Pathogen Effector Protein PexRD54

Affiliations

Structural Basis of Host Autophagy-related Protein 8 (ATG8) Binding by the Irish Potato Famine Pathogen Effector Protein PexRD54

Abbas Maqbool et al. J Biol Chem. .

Abstract

Filamentous plant pathogens deliver effector proteins to host cells to promote infection. The Phytophthora infestans RXLR-type effector PexRD54 binds potato ATG8 via its ATG8 family-interacting motif (AIM) and perturbs host-selective autophagy. However, the structural basis of this interaction remains unknown. Here, we define the crystal structure of PexRD54, which includes a modular architecture, including five tandem repeat domains, with the AIM sequence presented at the disordered C terminus. To determine the interface between PexRD54 and ATG8, we solved the crystal structure of potato ATG8CL in complex with a peptide comprising the effector's AIM sequence, and we established a model of the full-length PexRD54-ATG8CL complex using small angle x-ray scattering. Structure-informed deletion of the PexRD54 tandem domains reveals retention of ATG8CL binding in vitro and in planta This study offers new insights into structure/function relationships of oomycete RXLR effectors and how these proteins engage with host cell targets to promote disease.

Keywords: autophagy; effector protein; host-pathogen interaction; plant molecular biology; plant pathogen; protein structure; protein-protein interaction.


Figures

FIGURE 1.
FIGURE 1.
Interaction of PexRD54 and ATG8CL proteins in vitro. A, analytical gel filtration traces obtained for PexRD54 (top), ATG8CL (middle), and a 1:1 mixture of the complex (bottom). Insets show SDS-polyacrylamide gels of the fractions collected across the elution peaks. B, gel filtration trace derived from preparative purification of the PexRD54-ATG8CL complex following co-expression in E. coli. Inset, SDS-polyacrylamide gel containing purified complex. C, binding curve derived from SPR single cycle kinetics data for PexRD54 binding to ATG8CL.
FIGURE 2.
FIGURE 2.
CD spectra of PexRD54. Far-UV CD spectra of wild-type PexRD54 (solid line) and its variant PexRD54378-AEIA-381 (dashed line) confirming similar secondary structure content (predominantly α-helical).
FIGURE 3.
FIGURE 3.
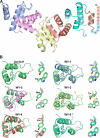
Crystal structure of PexRD54. A, schematic representation of the crystal structure of PexRD54 showing the five tandem WY domains (blue, magenta, yellow, coral, and cyan) and the disordered AIM motif at the C terminus (circles with single letter amino acid codes shown). The N and C termini are labeled. B, superimposition of the WY domains of AVR3a11 (top left, green) on the WY domains from PexRD54. The characteristic hydrophobic residues of each WY domain are also shown in stick representation. The PexRD54 WY domains are colored as in A.
FIGURE 4.
FIGURE 4.
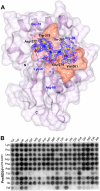
Crystal structure of ATG8CL bound to the PexRD54(377–381)-peptide and specificity of peptide binding. A, schematic representation of ATG8CL/PexRD54(377–381)-peptide complex highlighting key interactions. ATG8CL is shown in magenta schematic representation with the molecular surface that contacts the PexRD54(377–381)-peptide shown in orange. The PexRD54(377–381)-peptide is shown as sticks with yellow carbon atoms. The electron density omit map of the peptide ligand (FobsFcalc map) is shown in blue mesh and contoured at 2 σ. Electrostatic interactions are indicated with black dashed lines. B, results of the peptide array analyzing the effect of single amino acid substitutions (top) at all positions of 10-mer peptide of PexRD54 (Lys-372–Val-381, side). GST-tagged ATG8CL was visualized using an anti-GST-HRP antibody.
FIGURE 5.
FIGURE 5.
Analysis of SAXS data. A, P(r) distribution curves used for ab initio modeling. Left, PexRD54; right, PexRD54-ATG8CL complex. Dmax was set at 92 nm (PexRD54) and 120 nm (PexRD54/ATG8CL complex). Data were cropped at 0.35 Å−1 for analysis. B, left, fit of the theoretical scattering curve of PexRD54 from CRYSOL (red) to the PexRD54 scattering data (black). Right, fit of the theoretical scattering curve of the PexRD54-ATG8CL complex from CORAL (red) to the PexRD54-ATG8CL scattering data (black).
FIGURE 6.
FIGURE 6.
PexRD54 and PexRD54-ATG8CL complex analyzed by small angle x-ray scattering. A, fits of the most probable (lowest NSD) dummy atom models from DAMMIN for PexRD54 (left) and PexRD54/ATG8CL (right). The fit to the experimental data (in black) is shown in wheat and cyan, respectively, with χ2 shown as an inset. B, superposition of the crystal structure of PexRD54 with the most probable ab initio envelope of PexRD54 (wheat surface). C, superposition of the CORAL rigid body model of PexRD54/ATG8CL + pentapeptide with the most probable ab initio envelope of the complex (cyan surface). For B and C, two views are shown, face-on (left) and end-on (right). The fits shown in A and the envelopes shown in B and C are from the same run of DAMMIN.
FIGURE 7.
FIGURE 7.
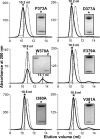
Analysis of the interaction between PexRD54 variants and ATG8CL by gel filtration. Analytical gel filtration traces were obtained for PexRD54 variants mutated in the AIM region and incubated with ATG8CL (1:1 mixture). Insets show SDS-polyacrylamide gels of the fractions at the elution peaks as marked by the dashed lines.
FIGURE 8.
FIGURE 8.
Interaction of PexRD54Δ218 and PexRD54Δ298 with ATG8CL in vitro and in planta. The binding affinities of PexRD54Δ218 (A) and PexRD54Δ298 (B) to ATG8CL were determined by ITC. Following a heats-of-dilution correction, a single-site binding model was used to fit the data using the MicroCal Origin software (data are shown on the top, with the fit on the bottom). The insets in the top panel depict the PexRD54 truncation used in the experiment, colored as in Fig. 3A. C, validation of PexRD54Δ218 and PexRD54Δ298 interaction with ATG8CL in plant cells by co-immunoprecipitation. Red asterisks indicate expected band sizes of the PexRD54 constructs. Degradation is due to autophagy, as seen previously (35).
FIGURE 9.
FIGURE 9.
CD spectra of truncated PexRD54 constructs. Far-UV CD spectra of PexRD54Δ218 (solid line), PexRD54Δ298 (long dash line), PexRD54Δ218AEIA (short dashed line), and PexRD54Δ298AEIA (dotted line) variants confirming a similar secondary structure composition (predominantly α-helical).

References

    1. Hurley J. H., and Schulman B. A. (2014) Atomistic autophagy: the structures of cellular self-digestion. Cell 157, 300–311 - PMC - PubMed
    1. Shaid S., Brandts C. H., Serve H., and Dikic I. (2013) Ubiquitination and selective autophagy. Cell Death Differ. 20, 21–30 - PMC - PubMed
    1. Reggiori F., and Klionsky D. J. (2013) Autophagic processes in yeast: mechanism, machinery and regulation. Genetics 194, 341–361 - PMC - PubMed
    1. Deretic V., Saitoh T., and Akira S. (2013) Autophagy in infection, inflammation and immunity. Nat. Rev. Immunol. 13, 722–737 - PMC - PubMed
    1. Levine B., Mizushima N., and Virgin H. W. (2011) Autophagy in immunity and inflammation. Nature 469, 323–335 - PMC - PubMed

Publication types

MeSH terms

Substances