. 2016 Aug 1;214(3):333-45.
doi: 10.1083/jcb.201603039. Epub 2016 Jul 25.

mito-QC illuminates mitophagy and mitochondrial architecture in vivo

Affiliations

mito-QC illuminates mitophagy and mitochondrial architecture in vivo

Thomas G McWilliams et al. J Cell Biol. .

Abstract

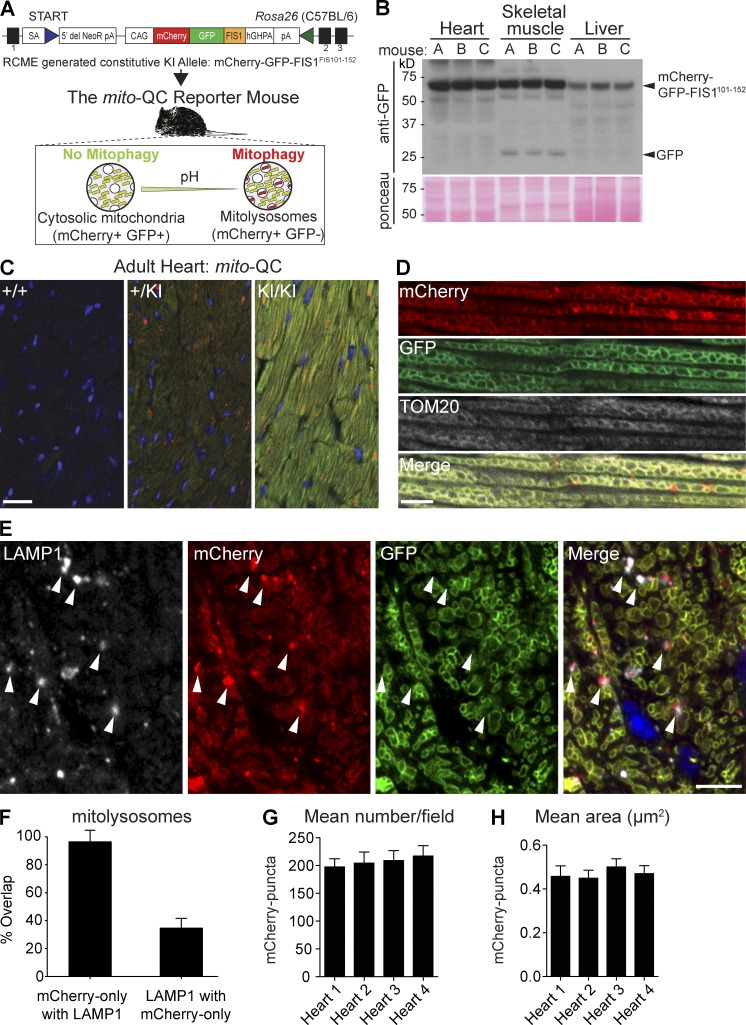
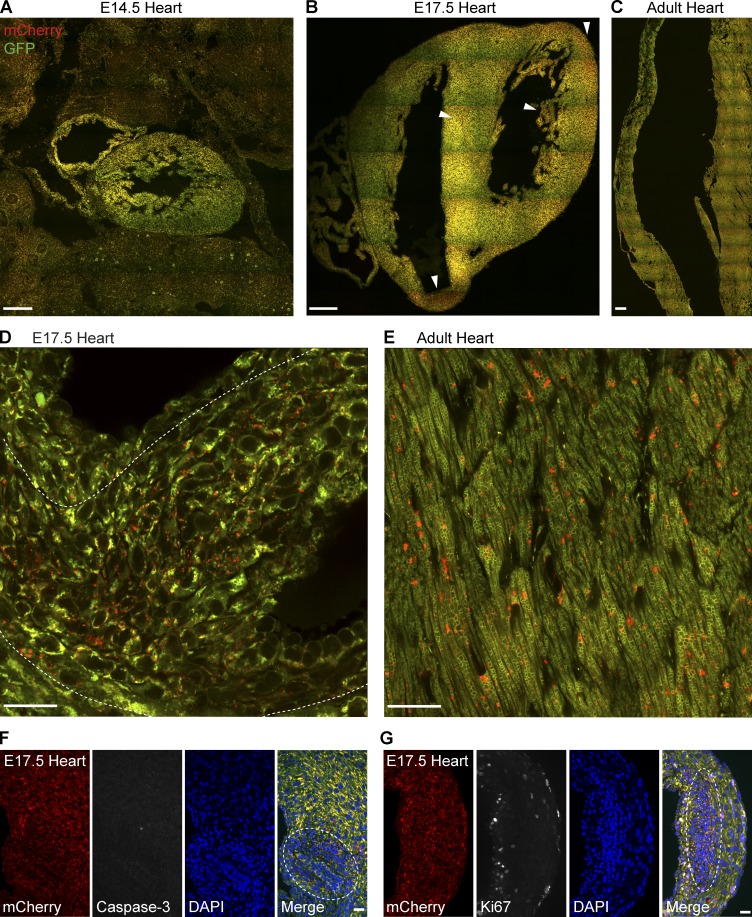
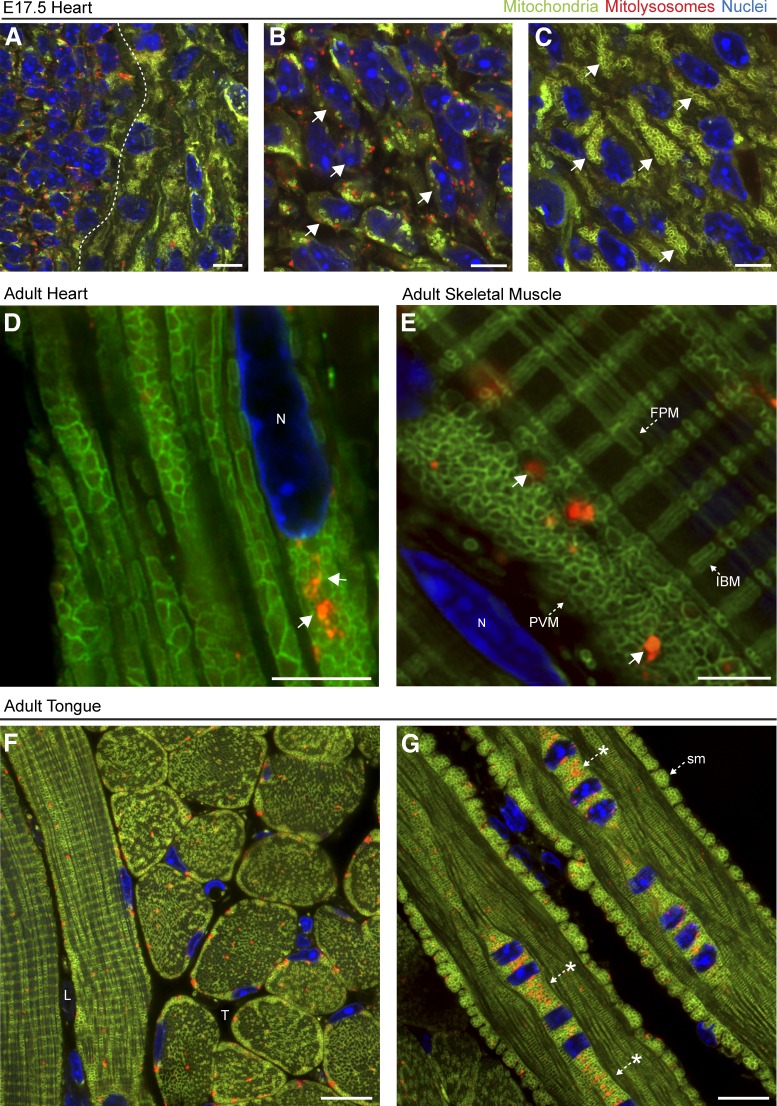
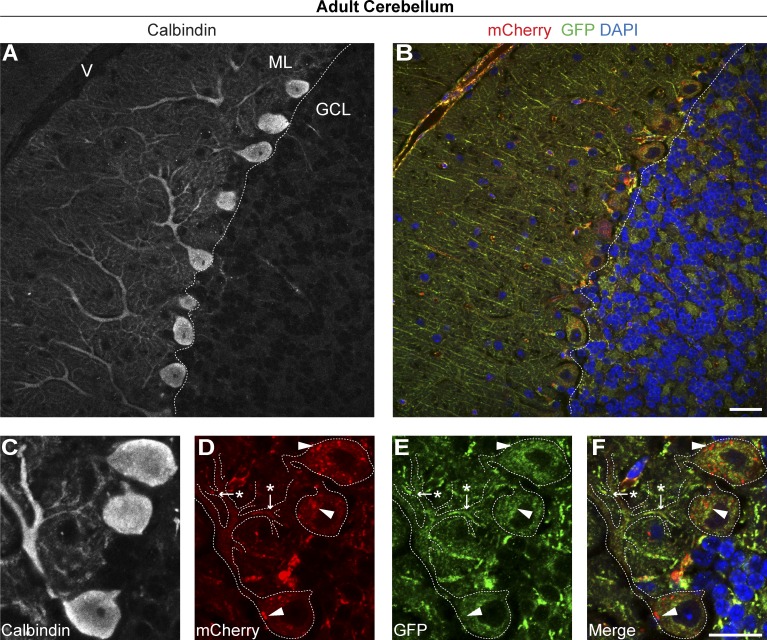
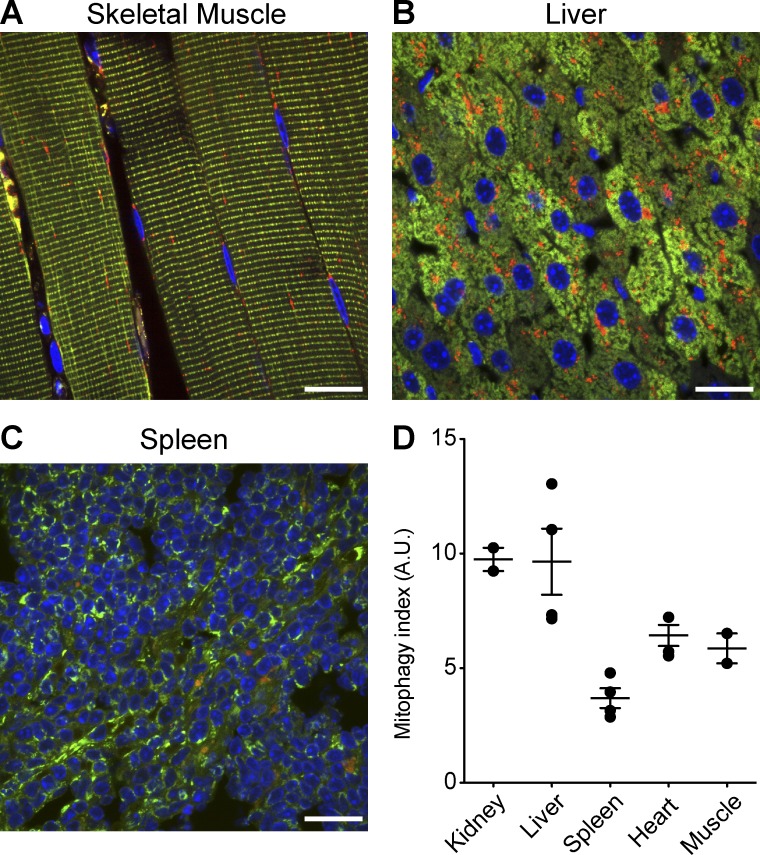
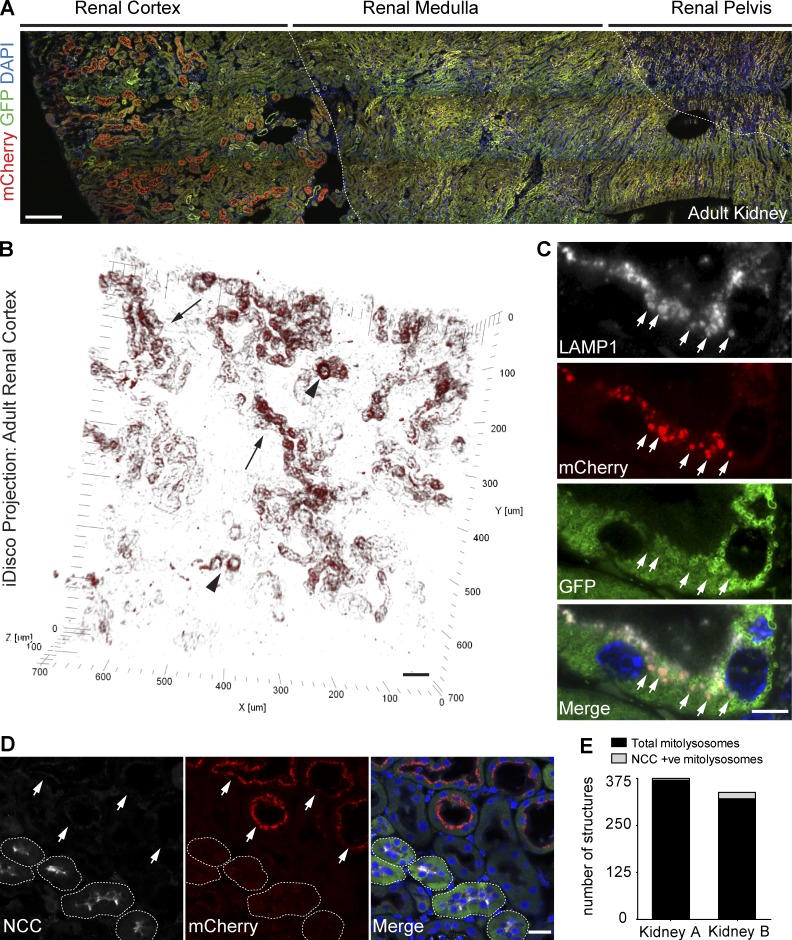
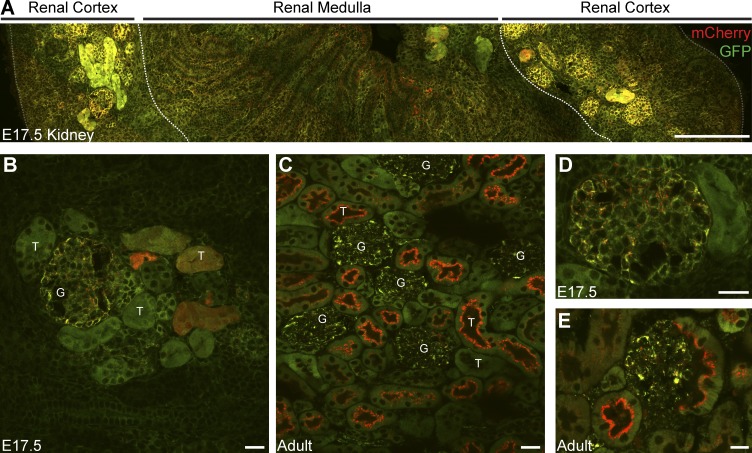
Autophagic turnover of mitochondria, termed mitophagy, is proposed to be an essential quality-control (QC) mechanism of pathophysiological relevance in mammals. However, if and how mitophagy proceeds within specific cellular subtypes in vivo remains unclear, largely because of a lack of tractable tools and models. To address this, we have developed "mito-QC," a transgenic mouse with a pH-sensitive fluorescent mitochondrial signal. This allows the assessment of mitophagy and mitochondrial architecture in vivo. Using confocal microscopy, we demonstrate that mito-QC is compatible with classical and contemporary techniques in histochemistry and allows unambiguous in vivo detection of mitophagy and mitochondrial morphology at single-cell resolution within multiple organ systems. Strikingly, our model uncovers highly enriched and differential zones of mitophagy in the developing heart and within specific cells of the adult kidney. mito-QC is an experimentally advantageous tool of broad relevance to cell biology researchers within both discovery-based and translational research communities.


Figures

Figure 1.
Figure 1.
Generation of the mito-QC mouse and detection of mitophagy and mitochondrial architecture in vivo. (A) Schematic of gene targeting strategy used to generate the mito-QC mouse model. (B) Representative anti-GFP immunoblot showing expression of the reporter construct in different tissues from heterozygous reporter mice (designated A, B, and C). Ponceau is shown to indicate protein loading. (C) Sections of adult heart isolated from mito-QC littermate mice. Images depict representative heart sections from animals with and without indicated copies of the reporter construct. DAPI nuclear stain shown in blue. Bar, 20 µm. (D) Images of mito-QC heart tissue sections immunolabeled with antibodies to the mitochondrial marker, TOM20. Bar, 5 µm. (E) mito-QC heart tissue sections immunolabeled with antibodies to the lysosomal marker LAMP1. Bar, 5 µm. Arrowheads indicate examples of LAMP1/mCherry-only (GFP-negative) colocalization. (F) Quantification of mCherry-positive mitolysosomes in heart sections obtained from homozygous mito-QC adult littermate mice (n = 4 mice). (G) Quantification of mean mitolysosome size between mito-QC adult littermate mice (n = 4 mice). (H) Quantitation of mean cardiac mitolysosome area in mito-QC adult littermate mice (n = 4 mice). Error bars in F–H depict standard deviation.
Figure 2.
Figure 2.
Differential and zonal regulation of cardiomitophagy during development. (A–C) Representative montage of tile-scan images of E14.5 (A), E17.5 (B), and adult heart (C) sections from mito-QC reporter mice. Arrowheads in B indicate areas of high mitophagy. As images are to scale, and only a representative sample of adult cardiac tissue is depicted in C. Bars, 200 µm. (D) High resolution Airyscan images showing a mitophagic zone (delineated by dotted line) in the E17.5 ventricle Bar, 20 µm. (E) Representative Airyscan image of adult ventricular cardiomyocytes in vivo. Bar, 20 µm. (F) Immunostaining of E17.5 heart sections with anti–activated caspase-3 antibodies. Dotted line highlights high mitophagic zone. Bar, 20 µm. (G) Immunostaining of E17.5 heart sections with anti-Ki67 antibodies. Dotted line highlights high mitophagic zone. Bar, 20 µm.
Figure 3.
Figure 3.
Comparative overview of mitochondrial networks in developing and adult muscle tissues in vivo. (A–C) High-resolution Airyscan images of E17.5 heart. Dotted line indicates division between high and low mitophagic regions. Magnified photomicrographs of mitochondrial architecture in regions with high and low degrees of mitophagy are shown in B and C, respectively. Arrows highlight the differential organization of mitochondrial networks within cells of the same tissue. (D) High-magnification Airyscan image of adult mito-QC heart, depicting the mitochondrial architecture and the position of mitolysosomes (arrows) within ventricular cardiomyocytes in vivo. N, Nucleus. (E) High-magnification Airyscan image of a mitochondrial network depicting mitolysosomes and aspects of the recently described mitochondrial reticulum within adult skeletal muscle. Arrows indicate different muscle mitochondrial morphologies. FPM, fiber parallel mitochondria; PVM, paraventricular mitochondria; IBM, I-band mitochondria. Bars, 5 µm. (F and G) Representative images from parasagittal sections of adult tongue from a mito-QC reporter mouse. Bars, 10 µm. (F) Image shows transverse (T) and longitudinal (L) fibrils containing mitochondrial networks and mitolysosomes. (G) Image of a longitudinal tongue muscle fiber with sarcolemmal (sm) mitochondria at the periphery of the fiber and a cluster of mitolysosomes at a multinucleated orthogonal intersection (asterisks). DAPI is shown in blue throughout.
Figure 4.
Figure 4.
Mitophagy and mitochondrial architecture in defined subsets of cerebellar neurons. (A) Representative images from a parasagittal section of adult cerebellum from mito-QC reporter mouse, labeled with antibodies to the Purkinje neuron marker calbindin-D28K. ML, molecular layer; GCL, granule cell layer; V, vasculature. (B) Reporter signal in same immunolabeled region as A, with DAPI shown in blue. (C–F) Magnified view of a calbindin-positive Purkinje neuron in the cerebellum, with panels showing calbindin (C), mCherry (D), GFP (E), and merge (with DAPI; F). Dashed lines demarcate calbindin-positive neuronal processes, whereas arrows/asterisks highlight mitochondria (mCherry- and GFP-positive) situated at dendritic bifurcation points and arrowheads highlight examples of mitophagy (mCherry only) in the soma. Bars, 20 µm.
Figure 5.
Figure 5.
Tissue-wide quantitation of mitophagy in vivo. Representative images of skeletal muscle (A), liver (B), and spleen (C) used to perform generalized analysis of mammalian mitophagy across selected tissues in vivo. (D) Scatterplot depicting the mean relative level of global mitophagy in different organs in vivo, where each data point represents an organ from an individual animal and error bars represent standard error. Bars, 20 µm.
Figure 6.
Figure 6.
The renal tubules are a major site of mammalian mitophagy in vivo. (A) Tile scan showing parasagittal view of a representative adult kidney section from a mito-QC reporter mouse. Dashed lines demarcate macro-anatomical regions of the kidney, (lateral-medial from left-right). Bar, 200 µm. (B) 3D projection showing the spatial distribution of mitolysosomes within renal cortical tubules in vivo. Image acquired using iDISCO from an intact, cleared, and nonimmunolabeled mito-QC adult kidney with multiphoton microscopy. Arrows depict long stretches of cortical tubules with mitophagy, whereas arrowheads depict more restricted zones of mitophagy within tubules. Bar, 50 µm. (C) Representative Airyscan images from LAMP1 immunostained adult mito-QC kidney sections. Arrows highlight lysosomes containing degraded mitochondria. Bar, 5 µm. (D) Image showing adult mito-QC kidney sections immunolabeled with antibodies to the DCT marker, NCC. NCC-positive DCTs are demarcated by dashed lines, whereas arrows highlight NCC-immunonegative PCTs exhibiting pronounced apical mitophagy. DAPI is shown in blue. Bar, 20 µm. (E) Sample semiquantitative analysis of mitophagy in renal cortical tubules of mito-QC adult littermate kidneys. Data represent mean number of total and NCC-positive mitolysosomes, generated from a single kidney from two individual animals, with 15 fields analyzed per animal. Data from these kidneys were also used for Fig. 5 D.
Figure 7.
Figure 7.
Spatiotemporal regulation of renal mitophagy. (A) Tile scan showing a parasagittal view of a representative embryonic kidney from an E17.5 mito-QC reporter embryo. Dashed lines demarcate macroanatomical regions of the kidney. Bar, 200 µm. (B and C) Representative image of renal cortex from sections of E17.5 and adult kidney. G, glomerulus; T, tubule. Magnified view of glomeruli from (D) embryonic and (E) adult kidney. Bars, 20 µm.

References

    1. Airik R., and Kispert A.. 2007. Down the tube of obstructive nephropathies: the importance of tissue interactions during ureter development. Kidney Int. 72:1459–1467. 10.1038/sj.ki.5002589 - DOI - PubMed
    1. Allen G.F., Toth R., James J., and Ganley I.G.. 2013. Loss of iron triggers PINK1/Parkin-independent mitophagy. EMBO Rep. 14:1127–1135. 10.1038/embor.2013.168 - DOI - PMC - PubMed
    1. Barbosky L., Lawrence D.K., Karunamuni G., Wikenheiser J.C., Doughman Y.Q., Visconti R.P., Burch J.B., and Watanabe M.. 2006. Apoptosis in the developing mouse heart. Dev. Dyn. 235:2592–2602. 10.1002/dvdy.20885 - DOI - PubMed
    1. Bingol B., Tea J.S., Phu L., Reichelt M., Bakalarski C.E., Song Q., Foreman O., Kirkpatrick D.S., and Sheng M.. 2014. The mitochondrial deubiquitinase USP30 opposes parkin-mediated mitophagy. Nature. 510:370–375. http://dx.doi.org/10.1038/nature13418 - PubMed
    1. Brown D., Lydon J., McLaughlin M., Stuart-Tilley A., Tyszkowski R., and Alper S.. 1996. Antigen retrieval in cryostat tissue sections and cultured cells by treatment with sodium dodecyl sulfate (SDS). Histochem. Cell Biol. 105:261–267. 10.1007/BF01463929 - DOI - PubMed