. 2016 Oct;15(10):2442-2454.
doi: 10.1158/1535-7163.MCT-15-0963. Epub 2016 Jul 25.

Hypoxia-Driven Mechanism of Vemurafenib Resistance in Melanoma

Affiliations

Hypoxia-Driven Mechanism of Vemurafenib Resistance in Melanoma

Yong Qin et al. Mol Cancer Ther. 2016 Oct.

Abstract

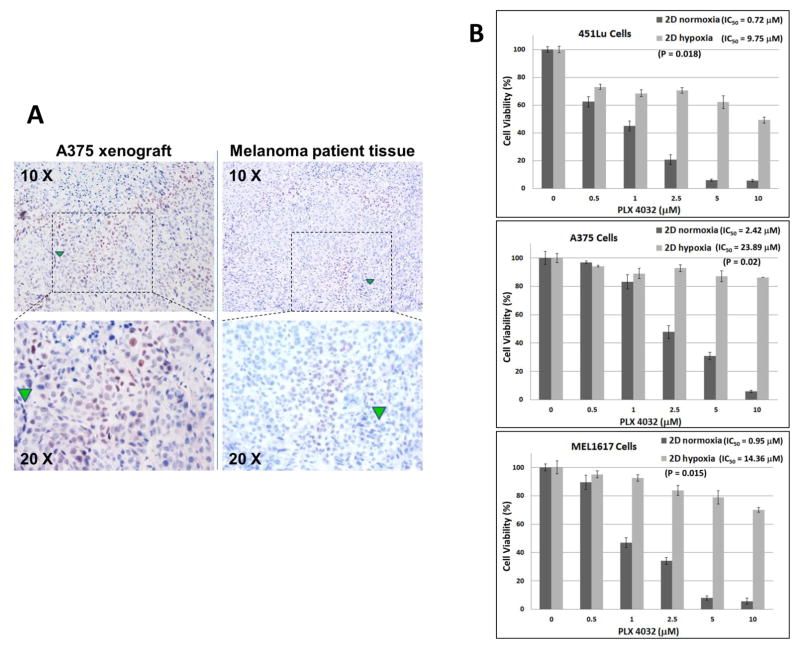
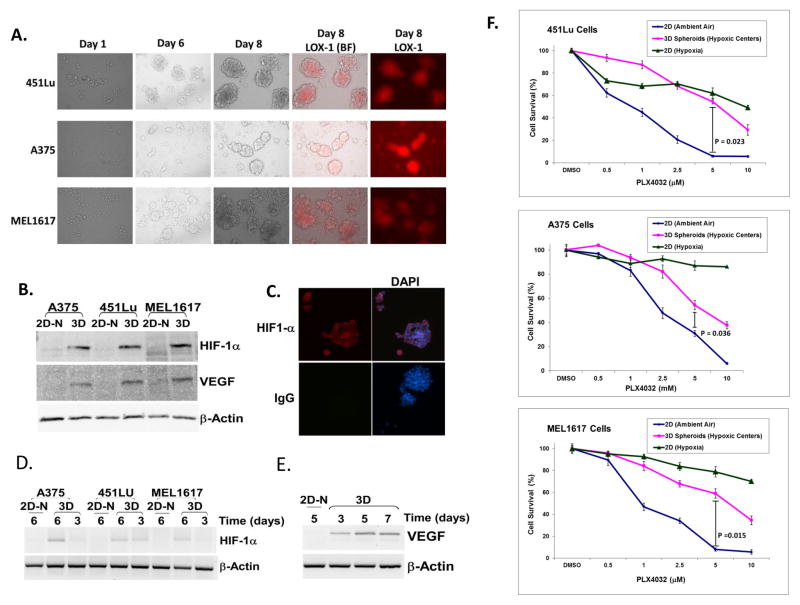
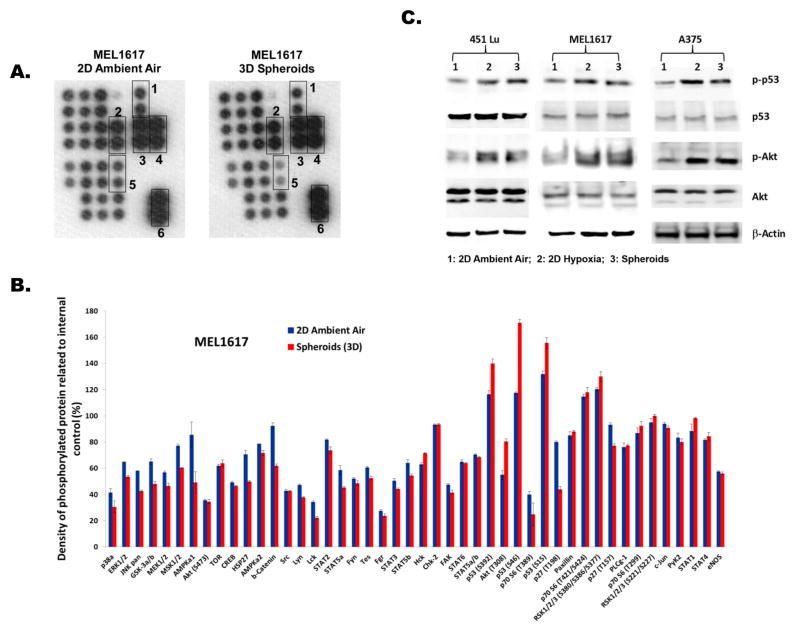
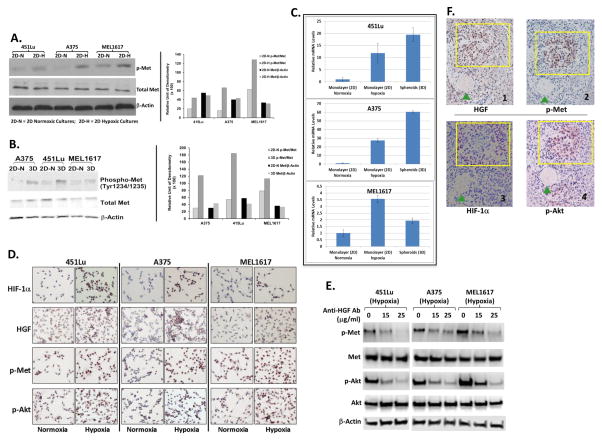
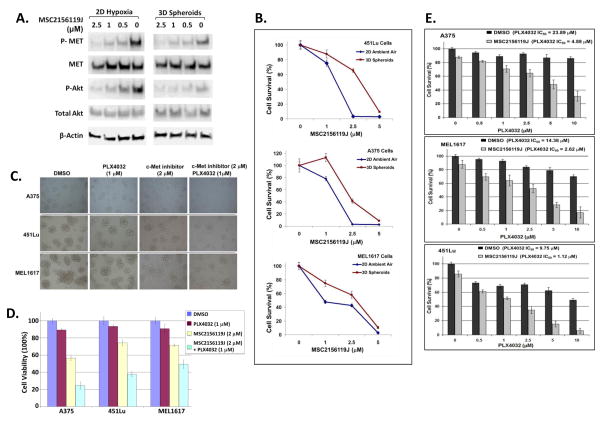
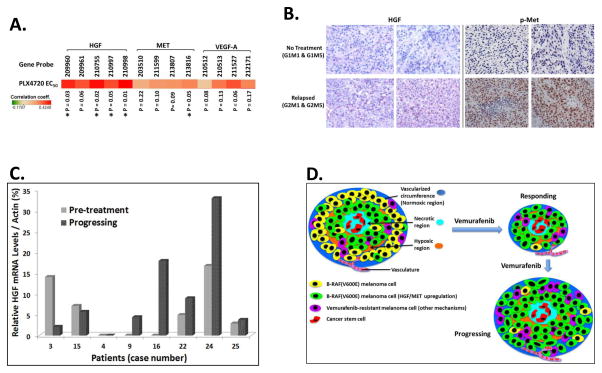
Melanoma is molecularly and structurally heterogeneous, with some tumor cells existing under hypoxic conditions. Our cell growth assays showed that under controlled hypoxic conditions, BRAF(V600E) melanoma cells rapidly became resistant to vemurafenib. By employing both a three-dimensional (3D) spheroid model and a two-dimensional (2D) hypoxic culture system to model hypoxia in vivo, we identified upregulation of HGF/MET signaling as a major mechanism associated with vemurafenib resistance as compared with 2D standard tissue culture in ambient air. We further confirmed that the upregulation of HGF/MET signaling was evident in drug-resistant melanoma patient tissues and mouse xenografts. Pharmacologic inhibition of the c-Met/Akt pathway restored the sensitivity of melanoma spheroids or 2D hypoxic cultures to vemurafenib. Mol Cancer Ther; 15(10); 2442-54. ©2016 AACR.


Figures

Figure 1
Figure 1. Hypoxia in melanoma and growth inhibitory effects of PLX4032 in melanoma cells under hypoxia or ambient air
(A) Representative IHC staining for HIF-1α in mouse xenograft and melanoma patient tissue. The areas that stained positive for HIF-1α indicated the hypoxic tumor regions. Green triangles indicated the same locations under 10 X and 20 X views. (B) Dose-dependent inhibition of BRAF(V600E) melanoma cells growth by PLX4032 under normoxia and hypoxia. 451Lu, A375, and MEL1617 cells were treated with PLX4032 at the indicated doses. After 72 h of culture, cell survival was determined via MTT assay. The percent cell survival in each treatment group was calculated relative to cells treated with medium only under the same conditions. As controls, the growth of cells without drug treatment under each condition was normalized as 100% separately. Each experiment was carried out three times, and the means were presented here. Each bar denotes mean ± SD of three experiments. IC50 values were calculated by GraphPad Prism 6. The Student’s t-test was performed to compare IC50 values of the same cell lines under different culture conditions. p ≤ 0.05 was considered statistically significant.
Figure 2
Figure 2. Formation of melanoma spheroids and their sensitivity to PLX4032 as compared to 2D ambient air cultures
(A) Formation and morphology of 3D melanoma spheroids on NCPs. 451Lu, A375, or MEL1617 cells were seeded at 4×10³ in each well of 24-well NCPs. Periodic analysis showed the formation of human melanoma cell spheroids on NCPs. The majority of melanoma cells in spheroids were identified as hypoxic, as indicated by the specific hypoxic probe LOX-1. BF = Brightfield. LOX-1(BF) = merging images of LOX-1 and BF. (B) The formation of hypoxic centers in human melanoma spheroids induced the expression of HIF-1α and VEGF. We subjected 50 μg of protein lysates from melanoma 2D cultures with ambient air or 3D spheroids (7 days) to Western blotting for HIF-1α and VEGF. HIF-1α and VEGF were dramatically increased in spheroids compared to 2D cultures with ambient air. 2D-N = 2D cultures with ambient air. (C) The immunofluorescent staining of HIF-1α in A375 spheroids. The high levels of HIF-1α indicate the formation of hypoxic centers in melanoma spheroids. DAPI staining indicates the location of nuclei. (D) The expression of HIF-1α mRNA on days 3 and 6 of melanoma spheroids compared to 2D ambient air cultures. (E) The RT-PCR analysis of VEGF expression in A375 spheroids. The induction of VEGF was observed from A375 cells cultured on NCPs for 3, 5, and 7 days, but the VEGF mRNA was undetectable in 2D ambient air cultures. (F) The viability of 2D ambient air cultures and spheroids in three melanoma cells treated with various concentration of PLX4032. On day 4, the formation of melanoma spheroids on NCPs was confirmed by microscopy, and then they were treated with different concentrations of PLX4032. After drug treatment for 72 h, the spheroids were subjected to MTT assay. The 2D monolayer cultures of three melanoma cells under hypoxic or ambient air conditions were also subjected to PLX4032 treatment for 72 h. The Student’s t-test was performed to compare cell survival at 5 μM drug concentration. p ≤ 0.05 was considered statistically significant.
Figure 3
Figure 3. Comparison of kinase signaling between melanoma 3D spheroids and 2D ambient air cultures
(A) The human phospho-kinase antibody array of MEL1617 spheroids and 2D cultures with ambient air. The duplicate spots in boxes represent: 1. Akt(T308); 2. p53(S15); 3. p53(S46); 4. p53(S392); 5. p27(T198); and 6. reference spots (internal positive controls). (B) Relative changes in phosphorylated kinase proteins between melanoma 3D spheroids and 2D ambient air cultures. Error bar denotes mean ± SD of replicated samples. (C) Western blot analyses of p53, p-p53, Akt, and p-Akt levels in 2D ambient air cultures, 2D hypoxic cultures, and 3D spheroids of three melanoma cell lines. β-actin severed as the loading control.
Figure 4
Figure 4. Upregulation of HGF/MET signaling in hypoxic melanoma cells and spheroids
(A) Western blot analyses to compare p-Met levels between 2D cultures under hypoxia and ambient air in 451Lu, A375, and MEL1617 cells. Right panel: relative densitometries of p-Met to total Met and total Met to β-actin. 2D-N = 2D cultures with ambient air; 2D-H = 2D hypoxic cultures. (B) Western blot analyses to compare p-Met levels between spheroids and 2D ambient air cultures in 451Lu, A375, and MEL1617 cells. Right panel: relative densitometries of p-Met to total Met and total Met to β-actin. 3D = 3D spheroids. (C) Real-time PCR analyses to demonstrate the upregulation of HGF mRNA in 2D hypoxic cultures and spheroids compared to respective 2D ambient air cultures. (D) IHC analyses to demonstrate the upregulation of protein levels of HIF-1α, HGF, p-Akt, p-Met in 2D hypoxic cultures compared to respective 2D ambient air cultures. (E) Western blot analyses of p-Met and p-Akt (T308) levels in 2D hypoxic cultures of 451Lu, A375, and MEL1617 cells treated with HGF neutralizing antibodies. (F) IHC staining of HIF-1α, HGF, p-Akt, and p-Met in the subsequent tissue sections cut from the same tumor. The yellow rectangles indicate similar regions of tumor. The HIF-1α-positive tumor region was also positive for p-Akt, HGF and p-Met.
Figure 5
Figure 5. Blocking HGF/MET signaling by MSC2156119J inhibits the growth of melanoma spheroids and disrupts their formation
(A) Western blot analyses of p-Met/Met and p-AKt/Akt levels in A375 cells treated with Met inhibitor, MSC2156119J, under hypoxia conditions or in 3D spheroids. B-actin served as loading control. (B) Growth inhibition of melanoma 3D spheroids by MSC2156119J. After the formation of melanoma spheroids on NCPs on day 4, the spheroids were treated with various concentrations of MSC2156119J for 72 h. For 2D ambient air cultures, melanoma cells were treated with the same concentration of MSC2156119J for 72 h under ambient air conditions before being subjected to MTT assay for cell survival analysis. (C) Light microscopy images of melanoma spheroids treated with MSC2156119J and/or PLX4032 for 72 h. (D) Percentage of cell viability of cultures from experiment of 5B. (E) Dose-dependent inhibition of monolayer BRAF(V600E) melanoma cells growth by PLX4032 under hypoxia in the presence or absence of MSC2156119J. Each bar denotes mean ± SD of three experiments.
Figure 6
Figure 6. Correlation between HGF/MET signaling levels and sensitivity to vemurafenib in melanoma cell lines and tumor tissues
(A) Pearson’s correlation coefficients between the expression levels of three genes (HGF, MET, and VEGF-A) and relative efficacy to PLX4720 (EC50) in 35 melanoma cell lines. The red color in the heat map represents positive correlation, which indicates higher gene expression correlates with higher EC50 of drug. For each gene, the mRNA levels were detected by multiple probes. p value of coefficient for each probe (gene expression levels) and PLX4720 EC50 was shown at the bottom of the panel. * p ≤ 0.05. (B) IHC staining of HGF and p-Met in melanoma tissues from A375 xenografts. G1M1 and G1M5 mice were not treated with any drug. The recurrent tumor biopsy samples were obtained from G2M1 and G2M5 mice after the initial response to PLX4032 treatment while the mice had tumor progression during treatment. (C) The levels of HGF mRNA in 8 patients treated with BRAF(V600E) inhibitors. Paired cDNA samples from the same patient were prepared from the pre-treatment and progressing tumor sample. (D) Schematic depiction of hypoxia-driven upregulation of HGF/MET signaling contributing to vemurafenib resistance in BRAF(V600E) melanoma. Within hypoxic regions of tumor, some melanoma cells can sustain aberrant high levels of HGF/MET signaling and are resistant to the cytotoxic effects of vemurafenib. Upon treatment with vemurafenib, most sensitive BRAF(V600E) cells were killed. However, the melanoma cells that can genetically or epigenetically inherit upregulated HGF/MET signaling or other vemurafenib-resistant signaling pathways will survive treatment with vemurafenib and recur as drug-resistant tumors.

Similar articles

Cited by

References

    1. Davies H, Bignell GR, Cox C, Stephens P, Edkins S, Clegg S, et al. Mutations of the BRAF gene in human cancer. Nature. 2002;417:949–954. - PubMed
    1. Tsai J, Lee JT, Wang W, Zhang J, Cho H, Mamo S, et al. Discovery of a selective inhibitor of oncogenic BRAF kinase with potent antimelanoma activity. Proc Natl Acad Sci U S A. 2008;105:3041–3046. - PMC - PubMed
    1. Flaherty KT, Puzanov I, Kim KB, Ribas A, McArthur GA, Sosman JA, et al. Inhibition of mutated, activated BRAF in metastatic melanoma. N Engl J Med. 2010;363:809–819. - PMC - PubMed
    1. Wagle N, Emery C, Berger MF, Davis MJ, Sawyer A, Pochanard P, et al. Dissecting therapeutic resistance to RAF inhibition in melanoma by tumor genomic profiling. J Clin Oncol. 2011;29:3085–96. - PMC - PubMed
    1. Nazarian R, Shi H, Wang Q, Kong X, Koya RC, Lee H, et al. Melanomas acquire resistance to BRAF(V600E) inhibition by RTK or N-RAS upregulation. Nature. 2010;468:973–977. - PMC - PubMed

MeSH terms