

Fusidic Acid Inhibits Hepatic Transporters and Metabolic Enzymes: Potential Cause of Clinical Drug-Drug Interaction Observed with Statin Coadministration
- PMID: 27458210
- PMCID: PMC5038258
- DOI: 10.1128/AAC.01335-16
Fusidic Acid Inhibits Hepatic Transporters and Metabolic Enzymes: Potential Cause of Clinical Drug-Drug Interaction Observed with Statin Coadministration
Abstract
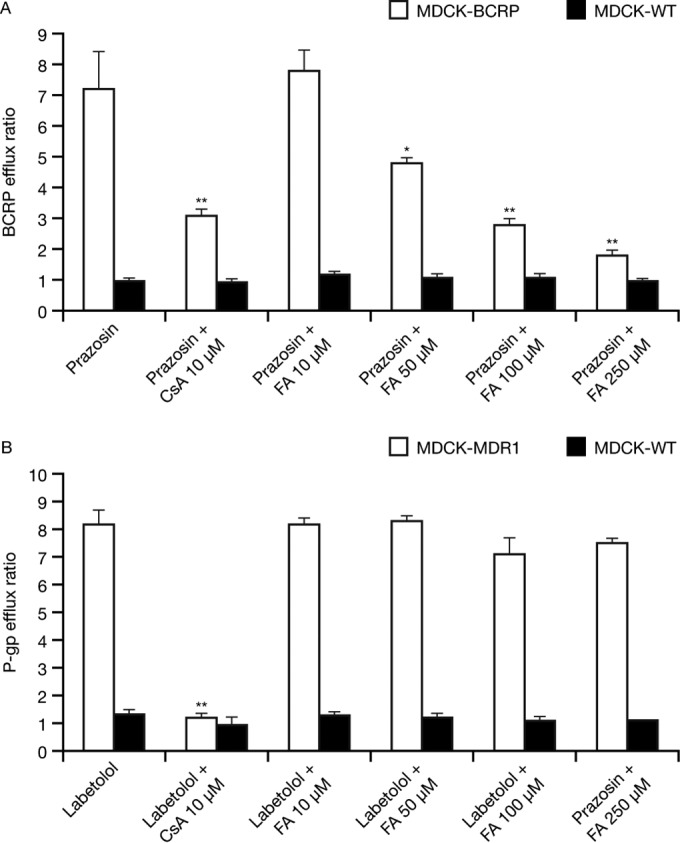
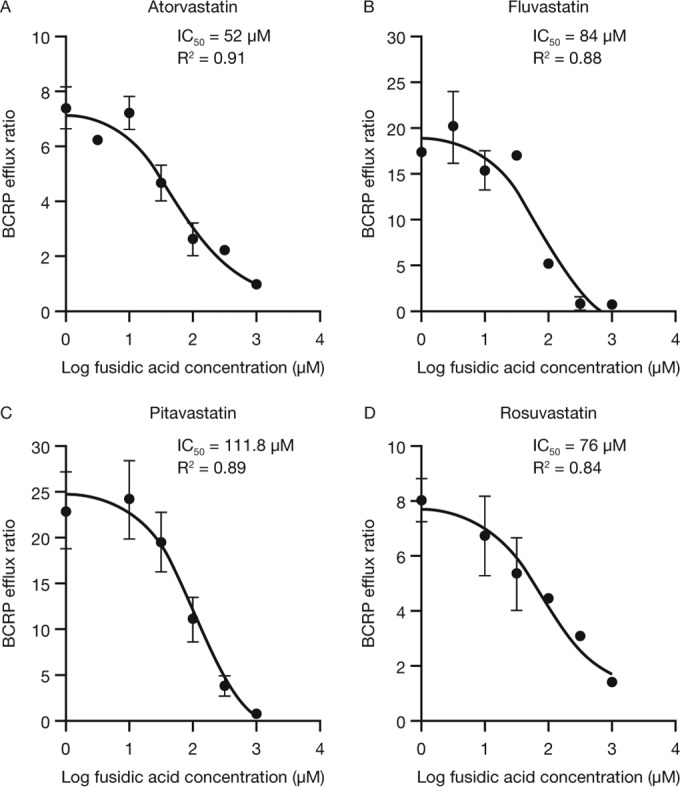
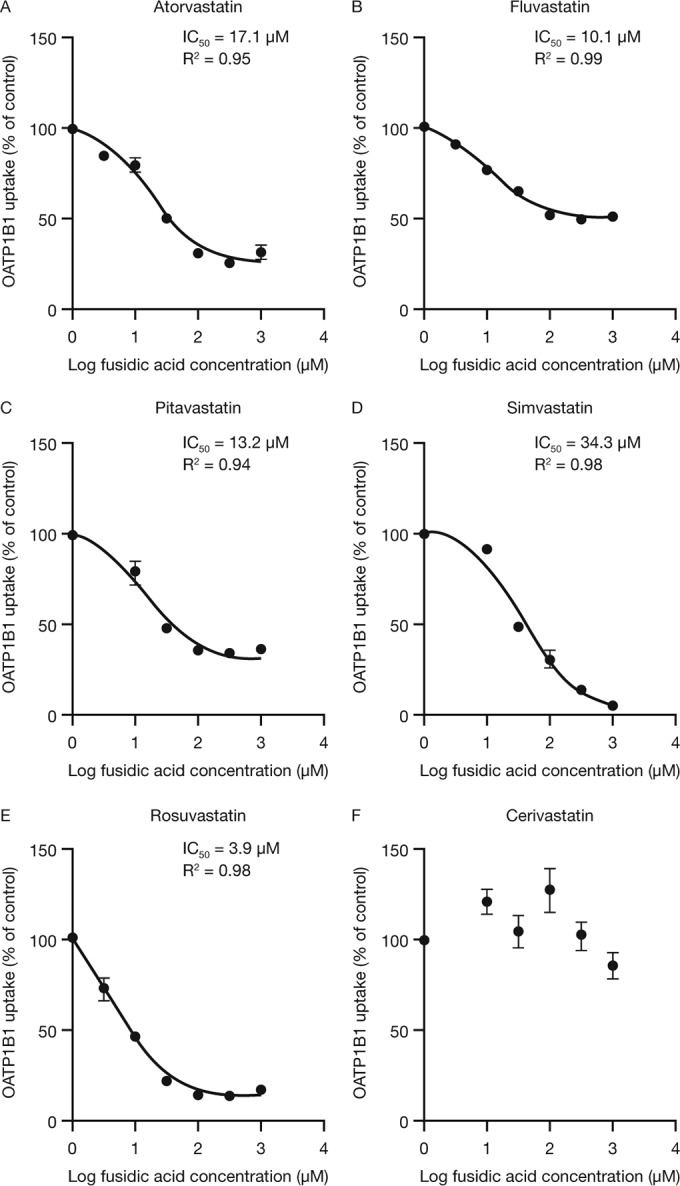
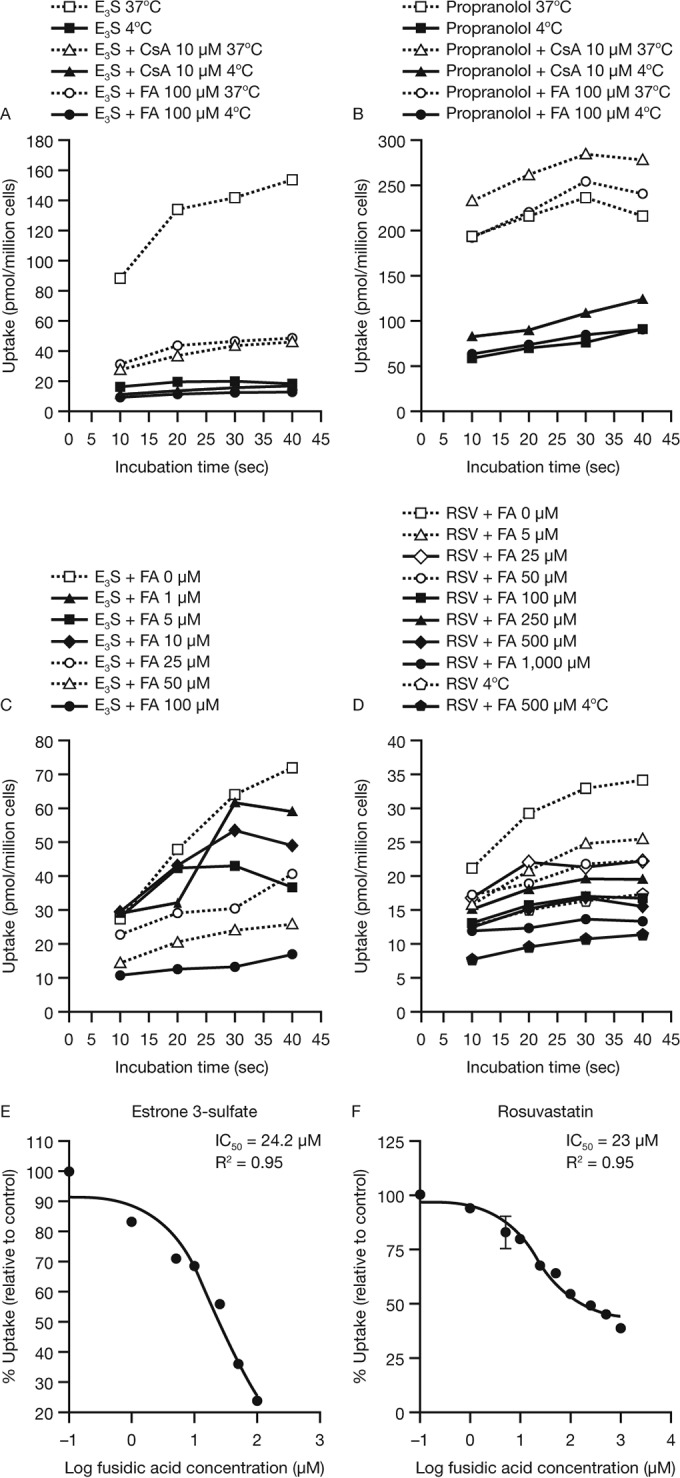
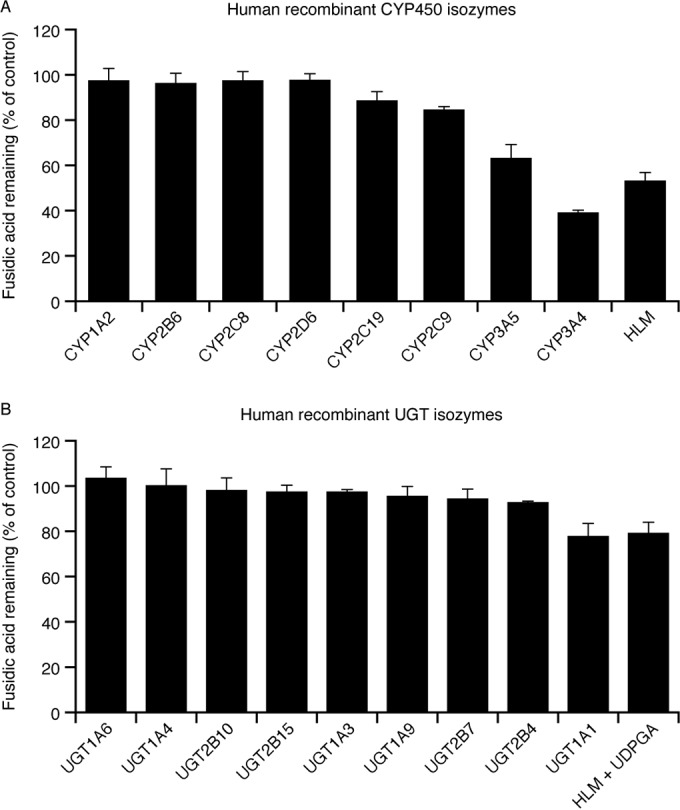
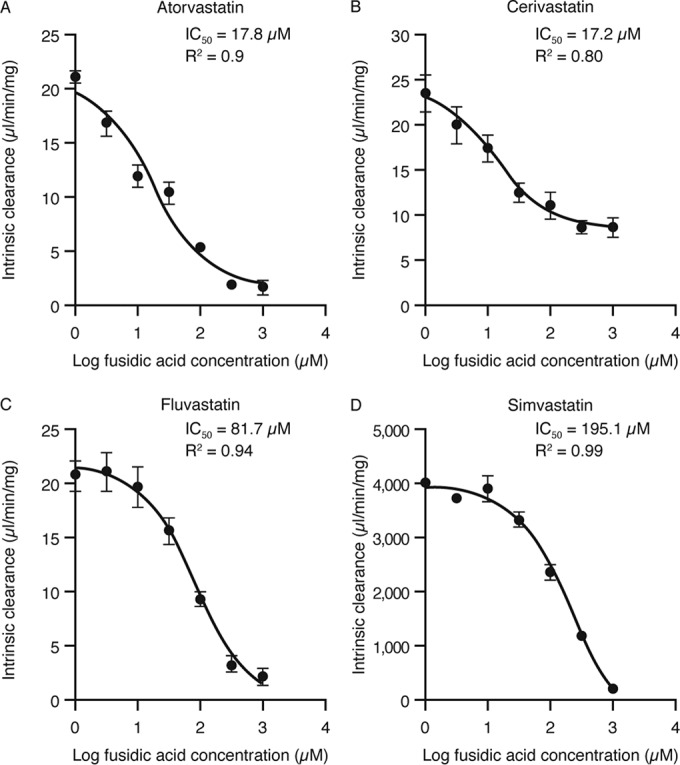
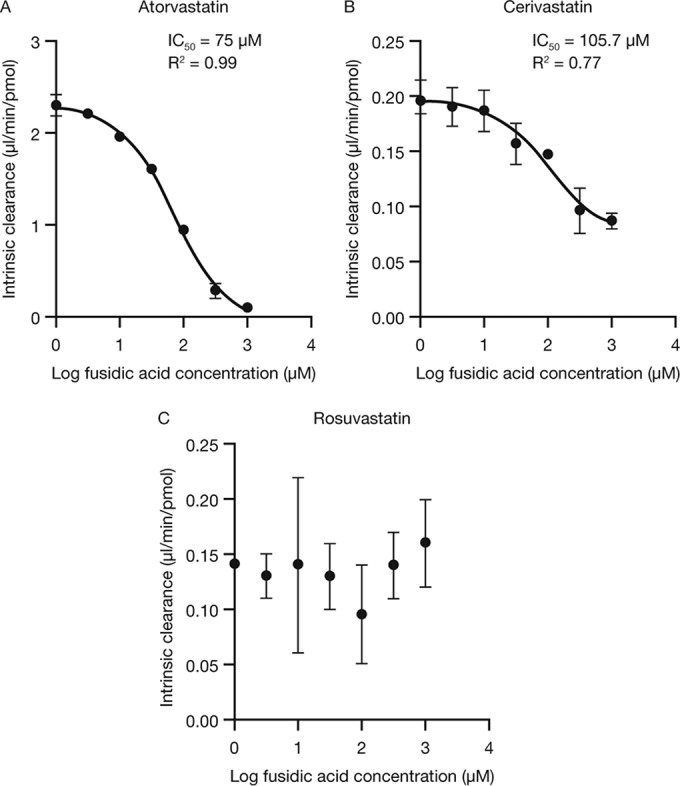
Fusidic acid (FA), which was approved in the 1960s in many European and Asian countries, has gained renewed interest due to its continued effectiveness against methicillin-resistant Staphylococcus aureus As rhabdomyolysis has been reported upon coadministration of FA with statins, we aimed to elucidate the underlying molecular mechanisms that contribute to FA-statin drug-drug interactions. Because of the association between rhabdomyolysis and increased exposure to statins, we investigated if cytochrome P450 (CYP) enzymes and transporters involved in the disposition of various statins are inhibited by FA. FA was found to inhibit BCRP and OATP1B1 but not P-gp. In overexpressing cell systems, FA inhibited BCRP-mediated efflux (50% inhibitory concentration [IC50], ∼50 to 110 μM) and OATP1B1-mediated uptake (IC50, ∼4 to 35 μM) of statins at clinically relevant concentrations achievable in the intestine and liver (based on a 550-mg oral dose of FA, the expected maximum theoretical gastrointestinal concentration is ∼4 mM, and the maximum total or unbound concentration in the inlet to the liver was reported to be up to 223 μM or 11 μM, respectively, upon multiple dosing). Similarly, FA inhibited metabolism of statins in human liver microsomes (IC50, ∼17 to 195 μM). These data suggest that FA inhibits at least 3 major dispositional pathways (BCRP, OATP1B1, and CYP3A) and thus affects the clearance of several statins. We confirmed that FA is eliminated via phase 1 metabolism (primarily via CYP3A); however, there is also some phase 2 metabolism (mediated primarily by UGT1A1). Taken together, these data provide evidence for molecular mechanisms that may explain the occurrence of rhabdomyolysis when FA is administered with statins.
Copyright © 2016, American Society for Microbiology. All Rights Reserved.
Figures
Similar articles
-
The Antimicrobial Agent Fusidic Acid Inhibits Organic Anion Transporting Polypeptide-Mediated Hepatic Clearance and May Potentiate Statin-Induced Myopathy.Drug Metab Dispos. 2016 May;44(5):692-9. doi: 10.1124/dmd.115.067447. Epub 2016 Feb 17. Drug Metab Dispos. 2016. PMID: 26888941
-
In vitro evaluation of potential drug interactions mediated by cytochrome P450 and transporters for luseogliflozin, an SGLT2 inhibitor.Xenobiotica. 2017 Apr;47(4):314-323. doi: 10.1080/00498254.2016.1193913. Epub 2016 Jun 20. Xenobiotica. 2017. PMID: 27324291
-
Rhinacanthin-C Mediated Herb-Drug Interactions with Drug Transporters and Phase I Drug-Metabolizing Enzymes.Drug Metab Dispos. 2019 Oct;47(10):1040-1049. doi: 10.1124/dmd.118.085647. Epub 2019 Aug 9. Drug Metab Dispos. 2019. PMID: 31399508
-
The role of OATP1B1 and BCRP in pharmacokinetics and DDI of novel statins.Cardiovasc Ther. 2012 Oct;30(5):e234-41. doi: 10.1111/j.1755-5922.2011.00290.x. Epub 2011 May 25. Cardiovasc Ther. 2012. PMID: 21884024 Review.
-
An update on efflux and uptake transporters as determinants of statin response.Expert Opin Drug Metab Toxicol. 2018 Jun;14(6):613-624. doi: 10.1080/17425255.2018.1482276. Epub 2018 Jun 8. Expert Opin Drug Metab Toxicol. 2018. PMID: 29842801 Review.
Cited by
-
Preclinical Evaluation of [18F]LCATD as a PET Tracer to Study Drug-Drug Interactions Caused by Inhibition of Hepatic Transporters.Contrast Media Mol Imaging. 2018 Jul 30;2018:3064751. doi: 10.1155/2018/3064751. eCollection 2018. Contrast Media Mol Imaging. 2018. PMID: 30154685 Free PMC article.
-
Identification of human pregnane X receptor antagonists utilizing a high-throughput screening platform.Front Pharmacol. 2024 Oct 23;15:1448744. doi: 10.3389/fphar.2024.1448744. eCollection 2024. Front Pharmacol. 2024. PMID: 39508053 Free PMC article.
-
Severe Rhabdomyolysis as Complication of Interaction between Atorvastatin and Fusidic Acid in a Patient in Lifelong Antibiotic Prophylaxis: A Dangerous Combination.Case Rep Med. 2016;2016:4705492. doi: 10.1155/2016/4705492. Epub 2016 Dec 27. Case Rep Med. 2016. PMID: 28115938 Free PMC article.
-
Development of Simple and Accurate in Silico Ligand-Based Models for Predicting ABCG2 Inhibition.Front Chem. 2022 May 18;10:863146. doi: 10.3389/fchem.2022.863146. eCollection 2022. Front Chem. 2022. PMID: 35665065 Free PMC article.
-
Rhabdomyolysis after co-administration of a statin and fusidic acid: an analysis of the literature and of the WHO database of adverse drug reactions.Br J Clin Pharmacol. 2018 May;84(5):1057-1063. doi: 10.1111/bcp.13515. Epub 2018 Feb 26. Br J Clin Pharmacol. 2018. PMID: 29337401 Free PMC article. Review.
References
-
- Chua K, Laurent F, Coombs G, Grayson ML, Howden BP. 2011. Not community-associated methicillin-resistant Staphylococcus aureus (CA-MRSA)! A clinician's guide to community MRSA—its evolving antimicrobial resistance and implications for therapy. Clin Infect Dis 52:99–114. doi:10.1093/cid/ciq067. - DOI - PubMed
-
- Leo Laboratories Ltd. 2013. Fucidin suspension. Summary of product characteristics Leo Laboratories Ltd, Berkshire, United Kingdom: http://www.medicines.org.uk/emc/medicine/2447 Accessed 11 September 2015.
MeSH terms
Substances
LinkOut - more resources
Full Text Sources
Other Literature Sources
Medical
Molecular Biology Databases
Research Materials
Miscellaneous
