

Trends in Obesity Prevalence in Adults With a History of Cancer: Results From the US National Health Interview Survey, 1997 to 2014
- PMID: 27458295
- PMCID: PMC5012707
- DOI: 10.1200/JCO.2016.66.4391
Trends in Obesity Prevalence in Adults With a History of Cancer: Results From the US National Health Interview Survey, 1997 to 2014
Abstract
Purpose: Obesity after a diagnosis of specific cancers has been associated with worse prognosis. We examined the trend in obesity prevalence among cancer survivors in the United States in the past two decades and compared trends with those of adults without a history of cancer.
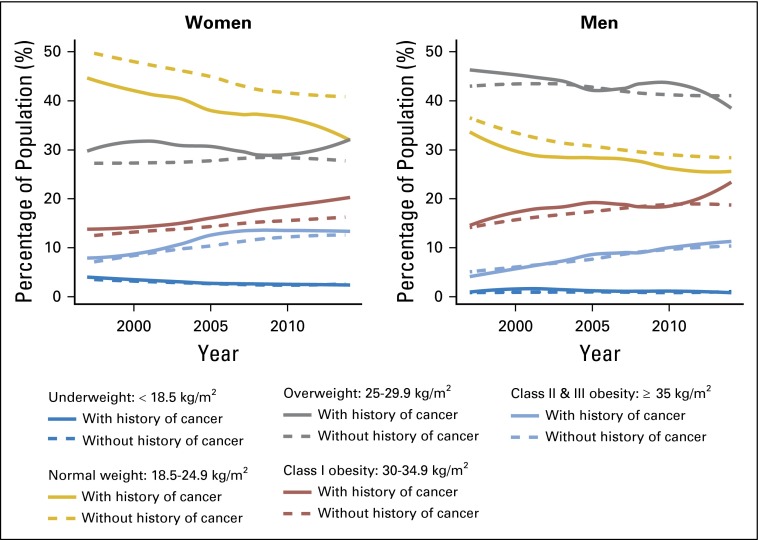
Patients and methods: This was a population-based nationally representative sample of 538,969 noninstitutionalized US adults 18 to 85 years old with and without a history of cancer who participated in annual cross-sectional National Health Interview Surveys from 1997 to 2014. Obesity was defined as body mass index ≥ 30 kg/m(2) for non-Asians and body mass index ≥ 27.5 kg/m(2) for Asians.
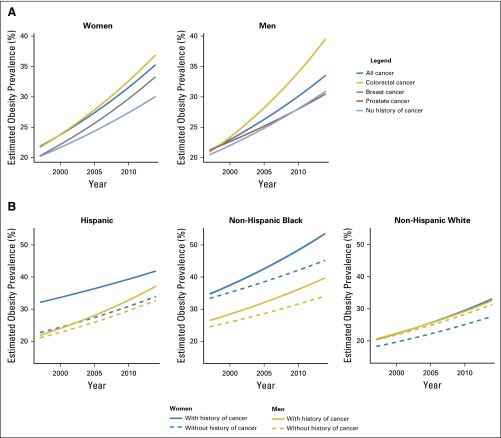
Results: Among 32,447 cancer survivors identified, the most common cancer diagnoses were breast (n = 6,948), prostate (n = 3,984), and colorectal (n = 2,546). From 1997 to 2014, the prevalence of obesity increased from 22.4% to 31.7% in cancer survivors and from 20.9% to 29.5% in adults without a history of cancer (P for trend < .001, both groups). Over this period, the estimated rate of annual increase in obesity prevalence was higher in women and men with a history of cancer compared with those without a history of cancer (all P for interaction < .001). The estimated rate of annual increase in obesity prevalence was 3.1% in female and 3.7% in male colorectal cancer survivors, 3.0% in breast cancer survivors, and 2.1% in prostate cancer survivors (all P < .001). In subgroup analyses, populations with the highest rates of increasing obesity burden were colorectal cancer survivors, breast cancer survivors, and non-Hispanic blacks.
Conclusion: From 1997 to 2014, obesity increased more rapidly among adult cancer survivors compared with the general population. Colorectal and breast cancer survivors and non-Hispanic blacks were identified as being at the highest risk for obesity.
© 2016 by American Society of Clinical Oncology.
Conflict of interest statement
Authors’ disclosures of potential conflicts of interest are found in the article online at www.jco.org. Author contributions are found at the end of this article.
Figures
Similar articles
-
Trends in obesity and adiposity measures by race or ethnicity among adults in the United States 2011-18: population based study.BMJ. 2021 Mar 16;372:n365. doi: 10.1136/bmj.n365. BMJ. 2021. PMID: 33727242 Free PMC article.
-
Racial and Ethnic Differences in Dietary Intake, Physical Activity, and Body Mass Index (BMI) Among Cancer Survivors: 2005 and 2010 National Health Interview Surveys (NHIS).J Racial Ethn Health Disparities. 2017 Dec;4(6):1138-1146. doi: 10.1007/s40615-016-0319-8. Epub 2017 Jan 11. J Racial Ethn Health Disparities. 2017. PMID: 28078657
-
Black-white disparities in overweight and obesity trends by educational attainment in the United States, 1997-2008.J Obes. 2013;2013:140743. doi: 10.1155/2013/140743. Epub 2013 Apr 10. J Obes. 2013. PMID: 23691282 Free PMC article.
-
Epidemiology of Obesity in Adults: Latest Trends.Curr Obes Rep. 2018 Dec;7(4):276-288. doi: 10.1007/s13679-018-0317-8. Curr Obes Rep. 2018. PMID: 30155850 Free PMC article.
-
Structural Racism, Lifestyle Behaviors, and Obesity-related Cancers among Black and Hispanic/Latino Adults in the United States: A Narrative Review.Cancer Epidemiol Biomarkers Prev. 2023 Nov 1;32(11):1498-1507. doi: 10.1158/1055-9965.EPI-22-1147. Cancer Epidemiol Biomarkers Prev. 2023. PMID: 37650844 Free PMC article. Review.
Cited by
-
Enabling exercise prescription for survivors of cancer.Sci Rep. 2021 May 5;11(1):9557. doi: 10.1038/s41598-021-89021-w. Sci Rep. 2021. PMID: 33953311 Free PMC article.
-
Impact of Cost-Related Medication Nonadherence on Economic Burdens, Productivity Loss, and Functional Abilities: Management of Cancer Survivors in Medicare.Front Pharmacol. 2021 Jun 29;12:706289. doi: 10.3389/fphar.2021.706289. eCollection 2021. Front Pharmacol. 2021. PMID: 34267667 Free PMC article.
-
From Surviving to Thriving: Key Considerations for Weight Control Across Diverse Cancer Survivorship Populations.Obes Sci Pract. 2024 Nov 29;10(6):e70027. doi: 10.1002/osp4.70027. eCollection 2024 Dec. Obes Sci Pract. 2024. PMID: 39619051 Free PMC article. Review.
-
The association of abdominal adiposity with premature discontinuation of postoperative chemotherapy in colon cancer.Clin Nutr. 2022 Jul;41(7):1600-1604. doi: 10.1016/j.clnu.2022.05.016. Epub 2022 May 27. Clin Nutr. 2022. PMID: 35671612 Free PMC article.
-
Metabolomics profiling of visceral and abdominal subcutaneous adipose tissue in colorectal cancer patients: results from the ColoCare study.Cancer Causes Control. 2020 Aug;31(8):723-735. doi: 10.1007/s10552-020-01312-1. Epub 2020 May 19. Cancer Causes Control. 2020. PMID: 32430684 Free PMC article.
References
-
- Roth GA, Nguyen G, Forouzanfar MH, et al. Estimates of global and regional premature cardiovascular mortality in 2025. Circulation. 2015;132:1270–1282. - PubMed
-
- Torre LA, Bray F, Siegel RL, et al. Global cancer statistics, 2012. CA Cancer J Clin. 2015;65:87–108. - PubMed
-
- Flegal KM, Carroll MD, Kit BK, et al. Prevalence of obesity and trends in the distribution of body mass index among US adults, 1999-2010. JAMA. 2012;307:491–497. - PubMed
-
- Wang YC, McPherson K, Marsh T, et al. Health and economic burden of the projected obesity trends in the USA and the UK. Lancet. 2011;378:815–825. - PubMed
MeSH terms
Grants and funding
LinkOut - more resources
Full Text Sources
Other Literature Sources
Medical
Miscellaneous
