. 2016 Jul 4:7:1049.
doi: 10.3389/fmicb.2016.01049. eCollection 2016.

Proteomic Analysis of the Hydrogen and Carbon Monoxide Metabolism of Methanothermobacter marburgensis

Affiliations

Proteomic Analysis of the Hydrogen and Carbon Monoxide Metabolism of Methanothermobacter marburgensis

Martijn Diender et al. Front Microbiol. .

Abstract

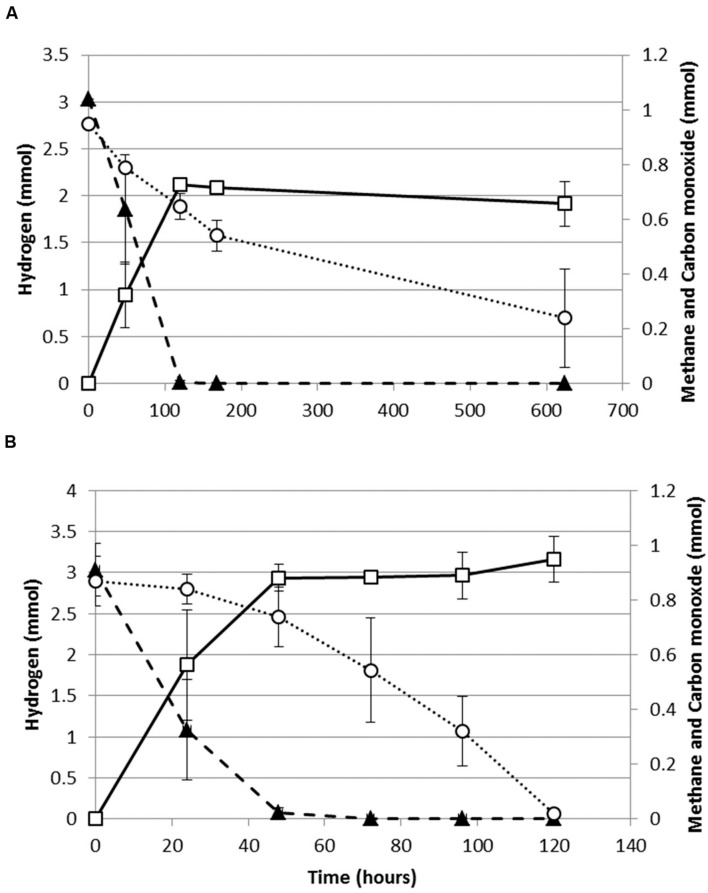
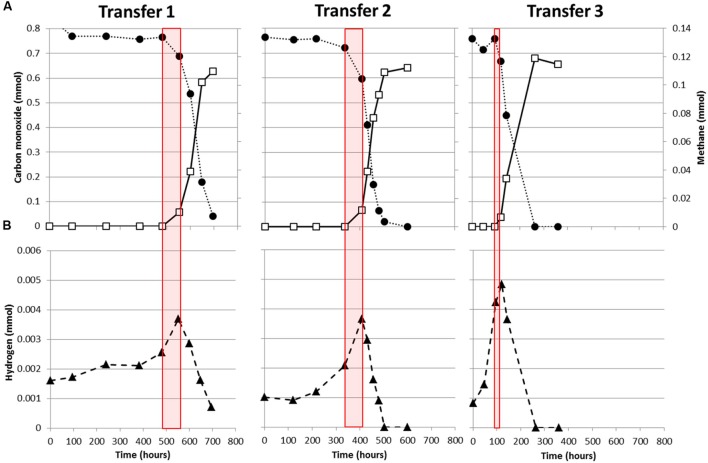
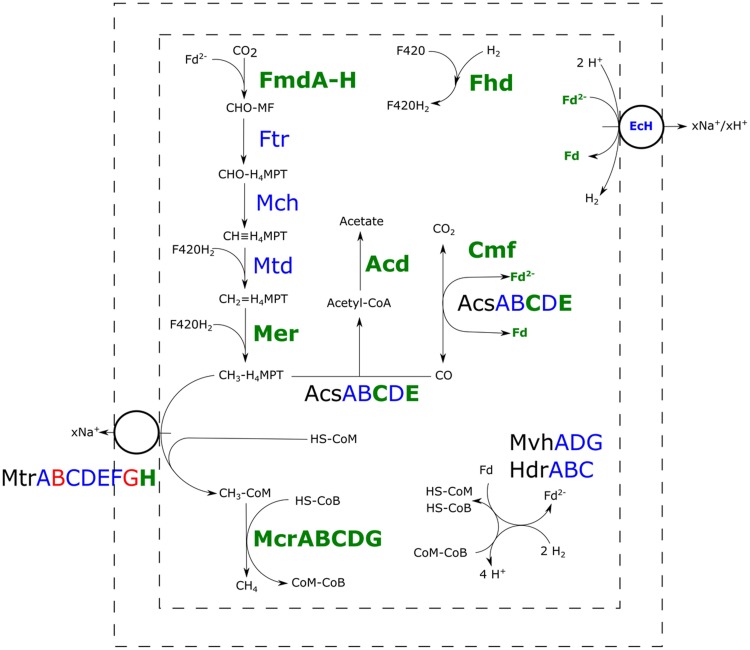
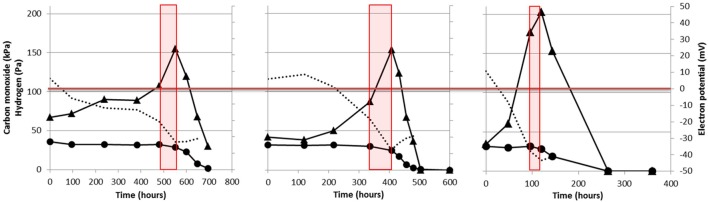
Hydrogenotrophic methanogenic archaea are efficient H2 utilizers, but only a few are known to be able to utilize CO. Methanothermobacter thermoautotrophicus is one of the hydrogenotrophic methanogens able to grow on CO, albeit about 100 times slower than on H2 + CO2. In this study, we show that the hydrogenotrophic methanogen Methanothermobacter marburgensis, is able to perform methanogenic growth on H2/CO2/CO and on CO as a sole substrate. To gain further insight in its carboxydotrophic metabolism, the proteome of M. marburgensis, grown on H2/CO2 and H2/CO2/CO, was analyzed. Cultures grown with H2/CO2/CO showed relative higher abundance of enzymes involved in the reductive acetyl-CoA pathway and proteins involved in redox metabolism. The data suggest that the strong reducing capacity of CO negatively affects hydrogenotrophic methanogenesis, making growth on CO as a sole substrate difficult for this type of methanogens. M. marburgensis appears to partly deal with this by up-regulating co-factor regenerating reactions and activating additional pathways allowing for formation of other products, like acetate.

Keywords: CODH; Methanothermobacter thermoautotrophicus; methanogenesis; reductive acetyl-CoA pathway; syngas.


Figures

FIGURE 1
FIGURE 1
Production profile of hydrogenotrophic methanogens growing on H2/CO2/CO. (A) Production profile of M. thermoautotrophicus. (B) Production profile of M. marburgensis. Hydrogen: solid black triangles, Methane: open black squares, Carbon monoxide: open black circles. Gas is represented as total amount of mmol present in the bottle headspace. Error bars display maximal and minimal amounts over duplicate experiments.
FIGURE 2
FIGURE 2
Adaptation of M. marburgensis to carboxydotrophic growth. (A) Consumption of CO (black solid circles) and production of methane (open squares). (B) H2 production and consumption profile during growth on CO. Red planes indicate the timeframe where methanogenesis is initiated. Gas is represented as total amount of mmol present in the bottle headspace.
FIGURE 3
FIGURE 3
Comparative proteomic analysis of methanogenic metabolism of M. marburgensis grown on H2/CO2/CO or H2/CO2. Relative abundance of proteins of carboxydotrophic growth compared to hydrogenotrophic growth is shown. Proteins highlighted green are found more abundantly present, proteins highlighted blue are not significantly changed in abundance and proteins highlighted in red are found to be less abundant in presence of CO (p < 0.05). Fmd, formyl-methanofuran dehydrogenase; Ftr, tetramethanopterin formyl-transferase; Mch, methenyltetramethanopterin cyclohydrolase; Mtd, methylene-H4MPT dehydrogenase; Mer, methylene-H4MPT reductase; Acs, acetyl-CoA synthase; Acd, acetyl-CoA synthetase; Cmf, CODH maturation factor; Mvh/Hdr, F420-non-reducing hydrogenase/heterodisulfide reductase; Mtr, tetrahydromethanopterin S-methyltransferase; Mcr, methyl-coenzyme M reductase; EcH, energy conserving hydrogenase; Fhd, F420 dehydrogenase; H4MPT, tetrahydromethanopterin; MF, methanofuran.
FIGURE 4
FIGURE 4
Thermodynamic analysis of the reaction catalyzed by the F420-non-reducing hydrogenase in M. marburgensis. The used dataset is the same as the one displayed in Figure 2. H2 pressure in Pa is given by the black triangles and the carbon monoxide pressure in kPa is given by the black circles. The estimated difference between the two reactions catalyzed by the bifurcating F420-non-reducing hydrogenase is indicated by the dotted black line. Red boxes indicate the phase where methanogenesis is initiated. The last time point is not assessed as the gasses had reached a pressure which could not be determined accurately.

References

    1. Abee T., Wouters J. A. (1999). Microbial stress response in minimal processing. Int. J. Food Microbiol. 50 65–91. 10.1016/S0168-1605(99)00078-1 - DOI - PubMed
    1. Adams M. W. (1990). The structure and mechanism of iron-hydrogenases. Biochim. Biophys. Acta 1020 115–145. 10.1016/0005-2728(90)90044-5 - DOI - PubMed
    1. Afting C., Hochheimer A., Thauer R. (1998). Function of H2-forming methylenetetrahydromethanopterin dehydrogenase from Methanobacterium thermoautotrophicum in coenzyme F420 reduction with H2. Arch. Microbiol. 169 206–210. 10.1007/s002030050562 - DOI - PubMed
    1. Afting C., Kremmer E., Brucker C., Hochheimer A., Thauer R. K. (2000). Regulation of the synthesis of H2-forming methylenetetrahydromethanopterin dehydrogenase (Hmd) and of HmdII and HmdIII in Methanothermobacter marburgensis. Arch. Microbiol. 174 225–232. 10.1007/s002030000197 - DOI - PubMed
    1. Bertsch J., Müller V. (2015). CO metabolism in the acetogen Acetobacterium woodii. Appl. Environ. Microbiol. 81 5949–5956. 10.1128/AEM.01772-15 - DOI - PMC - PubMed