

Relative Contributions of Agricultural Drift, Para-Occupational, and Residential Use Exposure Pathways to House Dust Pesticide Concentrations: Meta-Regression of Published Data
- PMID: 27458779
- PMCID: PMC5332194
- DOI: 10.1289/EHP426
Relative Contributions of Agricultural Drift, Para-Occupational, and Residential Use Exposure Pathways to House Dust Pesticide Concentrations: Meta-Regression of Published Data
Abstract
Background: Increased pesticide concentrations in house dust in agricultural areas have been attributed to several exposure pathways, including agricultural drift, para-occupational, and residential use.
Objective: To guide future exposure assessment efforts, we quantified relative contributions of these pathways using meta-regression models of published data on dust pesticide concentrations.
Methods: From studies in North American agricultural areas published from 1995 to 2015, we abstracted dust pesticide concentrations reported as summary statistics [e.g., geometric means (GM)]. We analyzed these data using mixed-effects meta-regression models that weighted each summary statistic by its inverse variance. Dependent variables were either the log-transformed GM (drift) or the log-transformed ratio of GMs from two groups (para-occupational, residential use).
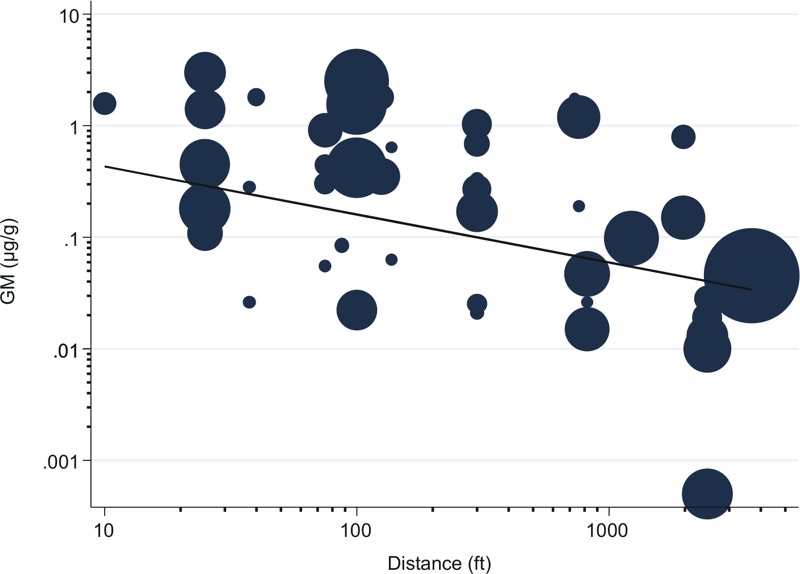
Results: For the drift pathway, predicted GMs decreased sharply and nonlinearly, with GMs 64% lower in homes 250 m versus 23 m from fields (interquartile range of published data) based on 52 statistics from seven studies. For the para-occupational pathway, GMs were 2.3 times higher [95% confidence interval (CI): 1.5, 3.3; 15 statistics, five studies] in homes of farmers who applied pesticides more recently or frequently versus less recently or frequently. For the residential use pathway, GMs were 1.3 (95% CI: 1.1, 1.4) and 1.5 (95% CI: 1.2, 1.9) times higher in treated versus untreated homes, when the probability that a pesticide was used for the pest treatment was 1-19% and ≥ 20%, respectively (88 statistics, five studies).
Conclusion: Our quantification of the relative contributions of pesticide exposure pathways in agricultural populations could improve exposure assessments in epidemiologic studies. The meta-regression models can be updated when additional data become available. Citation: Deziel NC, Beane Freeman LE, Graubard BI, Jones RR, Hoppin JA, Thomas K, Hines CJ, Blair A, Sandler DP, Chen H, Lubin JH, Andreotti G, Alavanja MC, Friesen MC. 2017. Relative contributions of agricultural drift, para-occupational, and residential use exposure pathways to house dust pesticide concentrations: meta-regression of published data. Environ Health Perspect 125:296-305; http://dx.doi.org/10.1289/EHP426.
Conflict of interest statement
N.C.D. declares that her spouse is employed by the Dow Chemical Company, a manufacturer of thousands of chemicals, including some pesticides.
The other authors declare no actual or potential competing financial interests.
Figures
References
-
- Aitchison J, Brown JAC. Cambridge, UK: Cambridge University Press; 1963. The Lognormal Distribution: with Special Reference to Its Uses in Economics.
-
- Arbuckle TE, Bruce D, Ritter L, Hall JC. Indirect sources of herbicide exposure for families on Ontario farms. J Expo Sci Environ Epidemiol. 2006;16:98–104. - PubMed
-
- Bouvier G, Seta N, Vigouroux-Villard A, Blanchard O, Momas I. Insecticide urinary metabolites in nonoccupationally exposed populations. J Toxicol Environ Health B Crit Rev. 2005;8:485–512. - PubMed
Publication types
MeSH terms
Substances
Grants and funding
LinkOut - more resources
Full Text Sources
Other Literature Sources
Medical
