Achieving NHAS 90/90/80 Objectives by 2020: An Interactive Tool Modeling Local HIV Prevalence Projections
- PMID: 27459717
- PMCID: PMC4961282
- DOI: 10.1371/journal.pone.0156888
Achieving NHAS 90/90/80 Objectives by 2020: An Interactive Tool Modeling Local HIV Prevalence Projections
Abstract
Background: Tools using local HIV data to help jurisdictions estimate future demand for medical and support services are needed. We present an interactive prevalence projection model using data obtainable from jurisdictional HIV surveillance and publically available data.
Methods: Using viral load data from Georgia's enhanced HIV/AIDS Reporting System, state level death rates for people living with HIV and the general population, and published estimates for HIV transmission rates, we developed a model for projecting future HIV prevalence. Keeping death rates and HIV transmission rates for undiagnosed, in care/viral load >200, in care/viral load<200, and out of care (no viral load for 12 months) constant, we describe results from simulations with varying inputs projecting HIV incidence and prevalence from 2014 to 2024.
Results: In this model, maintaining Georgia's 2014 rates for diagnosis, transitions in care, viral suppression (VS), and mortality by sub-group through 2020, resulted in 85% diagnosed, 59% in care, and 44% VS among diagnosed (85%/58%/44%) with a total of 67 815 PLWH, 33 953 in care, and more than 1000 new cases per year by 2020. Neither doubling the diagnosis rate nor tripling rates of re-engaging out of care PLWH into care alone were adequate to reach 90/90/80 by 2020. We demonstrate a multicomponent scenario that achieved NHAS goals and resulted in 63 989 PLWH, 57 546 in care, and continued annual prevalence increase through 2024.
Conclusions: Jurisdictions can use this HIV prevalence prediction tool, accessible at https://dph.georgia.gov/hiv-prevalence-projections to assess local capacity to meet future HIV care and social services needs. In this model, achieving 90/90/80 by 2020 in Georgia slowed but did not reverse increases in HIV prevalence, and the number of HIV-infected persons needing care and support services more than doubled. Improving the HIV care infrastructure is imperative.
Conflict of interest statement
Figures


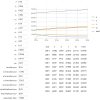
Increase the diagnosis rate (∂) by 10%
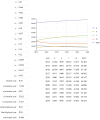
Triple the rates of re-entry into care and achieving VS (ϵs) and of re-entry in care but not VS (ϵn)
Halve the rates of loss from in care but not VS to out of care (On) and loss from in care and VS to out of care (Os)
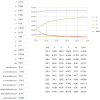
Double rate of transition in care but not VS to VS (σ)
Halve the recidivism rate of VS back to in care but not VS (ρ)
References
-
- Hall HI, Green TA, Wolitski RJ, Holtgrave DR, Rhodes P, Lehman JS, et al. Estimated Future HIV Prevalence, Incidence, and Potential Infections Averted in the United States: A Multiple Scenario Analysis J Acquir Immune Defic Syndr. 2010. October;55(2):271–6. - PubMed
-
- Garnett GP, Cousens S, Hallett TB, Steketee R, Walker N. Mathematical models in the evaluation of health programmes www.thelancet.com Vol378 August 6, 2011. - PubMed
-
- Office of National AIDS Policy, National HIV/AIDS Strategy for the United States: Updated to 2020, July 2015 [Internet]. Available from https://aids.gov/federal-resources/national-hiv-aids-strategy/nhas-updat... Accessed July 30, 2015
-
- Centers for Disease Control and Prevention (CDC) Monitoring selected national HIV prevention and care objectives by using HIV surveillance data—United States and 6 dependent areas—2012. HIV Surveillance Supplemental Report 2014;19(No. 3). Available from http://www.cdc.gov/hiv/library/reports/surveillance/ Published November 2014. Accessed May 19, 2016.
MeSH terms
LinkOut - more resources
Full Text Sources
Other Literature Sources
Medical

