Evolution of neurodegeneration-imaging biomarkers from clinically normal to dementia in the Alzheimer disease spectrum
- PMID: 27460147
- PMCID: PMC5018437
- DOI: 10.1016/j.neurobiolaging.2016.06.003
Evolution of neurodegeneration-imaging biomarkers from clinically normal to dementia in the Alzheimer disease spectrum
Abstract
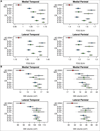
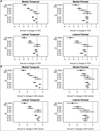
The availability of antemortem biomarkers for Alzheimer's disease (AD) enables monitoring the evolution of neurodegenerative processes in real time. Pittsburgh compound B (PIB) positron emission tomography (PET) was used to select participants in the Mayo Clinic Study of Aging and the Mayo Alzheimer's Disease Research Center with elevated β-amyloid, designated as "A+," and hippocampal volume and (18)fluorodeoxyglucose (FDG) positron emission tomography were used to characterize participants as having evidence of neurodegeneration ("N+") at the baseline evaluation. There were 145 clinically normal (CN) A+ individuals, 62 persons with mild cognitive impairment (MCI) who were A+ and 20 with A+ AD dementia. Over a period of 1-6 years, MCI A+N+ individuals showed declines in medial temporal, lateral temporal, lateral parietal, and to a lesser extent, medial parietal regions for both FDG standardized uptake value ratio and gray matter volume that exceeded declines seen in the CN A+N+ group. The AD dementia group showed declines in the same regions on FDG standardized uptake value ratio and gray matter volume with rates that exceeded that in MCI A+N+. Expansion of regional involvement and faster rate of neurodegeneration characterizes progression in the AD pathway.
Keywords: Alzheimer's disease; FDG PET imaging; Longitudinal study; MR imaging; PIB PET imaging.
Copyright © 2016 Elsevier Inc. All rights reserved.
Figures


Similar articles
-
Role of β-Amyloidosis and Neurodegeneration in Subsequent Imaging Changes in Mild Cognitive Impairment.JAMA Neurol. 2015 Dec;72(12):1475-83. doi: 10.1001/jamaneurol.2015.2323. JAMA Neurol. 2015. PMID: 26437123 Free PMC article.
-
Alzheimer Disease Signature Neurodegeneration and APOE Genotype in Mild Cognitive Impairment With Suspected Non-Alzheimer Disease Pathophysiology.JAMA Neurol. 2017 Jun 1;74(6):650-659. doi: 10.1001/jamaneurol.2016.5349. JAMA Neurol. 2017. PMID: 28319241 Free PMC article.
-
Selective worsening of brain injury biomarker abnormalities in cognitively normal elderly persons with β-amyloidosis.JAMA Neurol. 2013 Aug;70(8):1030-8. doi: 10.1001/jamaneurol.2013.182. JAMA Neurol. 2013. PMID: 23797806 Free PMC article.
-
Structural magnetic resonance imaging for the early diagnosis of dementia due to Alzheimer's disease in people with mild cognitive impairment.Cochrane Database Syst Rev. 2020 Mar 2;3(3):CD009628. doi: 10.1002/14651858.CD009628.pub2. Cochrane Database Syst Rev. 2020. PMID: 32119112 Free PMC article.
-
Early detection of Alzheimer's disease using PiB and FDG PET.Neurobiol Dis. 2014 Dec;72 Pt A:117-22. doi: 10.1016/j.nbd.2014.05.001. Epub 2014 May 10. Neurobiol Dis. 2014. PMID: 24825318 Free PMC article. Review.
Cited by
-
Anti-Amyloid-β Monoclonal Antibodies for Alzheimer's Disease: Pitfalls and Promise.Biol Psychiatry. 2018 Feb 15;83(4):311-319. doi: 10.1016/j.biopsych.2017.08.010. Epub 2017 Aug 24. Biol Psychiatry. 2018. PMID: 28967385 Free PMC article. Review.
-
Brain morphometry in older adults with and without dementia using extremely rapid structural scans.Neuroimage. 2023 Aug 1;276:120173. doi: 10.1016/j.neuroimage.2023.120173. Epub 2023 May 16. Neuroimage. 2023. PMID: 37201641 Free PMC article.
-
Imaging Translocator Protein as a Biomarker of Neuroinflammation in Dementia.Adv Pharmacol. 2018;82:163-185. doi: 10.1016/bs.apha.2017.08.004. Epub 2017 Nov 10. Adv Pharmacol. 2018. PMID: 29413519 Free PMC article. Review.
-
Cerebrospinal fluid and blood biomarkers for neurodegenerative dementias: An update of the Consensus of the Task Force on Biological Markers in Psychiatry of the World Federation of Societies of Biological Psychiatry.World J Biol Psychiatry. 2018 Jun;19(4):244-328. doi: 10.1080/15622975.2017.1375556. Epub 2017 Oct 27. World J Biol Psychiatry. 2018. PMID: 29076399 Free PMC article. Review.
-
Artificial Intelligence Predictor for Alzheimer's Disease Trained on Blood Transcriptome: The Role of Oxidative Stress.Int J Mol Sci. 2022 May 7;23(9):5237. doi: 10.3390/ijms23095237. Int J Mol Sci. 2022. PMID: 35563628 Free PMC article.
References
-
- Albert M, DeKosky ST, Dickson D, Dubois B, Feldman H, Fox NC, Gamst A, Holtzman D, Jagust WJ, Petersen RC, Snyder PJ, Phelps CH. The diagnosis of mild cognitive impairment due to Alzheimer's disease: recommendations from the National Institute on Aging– Alzheimer's Association workgroups on diagnostic guidelines for Alzheimer’s disease. Alzheimer's & Dementia: Journal of the Alzheimer's Association. 2011;7:270–279. - PMC - PubMed
-
- Ashburner J. Computational anatomy with the SPM software. Magn Reson Imaging. 2009;27:1163–1174. - PubMed
-
- Braak H, Braak E. Neuropathological staging of Alzheimer-related changes. Acta Neuropathol (Berl) 1991;82:239–259. - PubMed
Publication types
MeSH terms
Grants and funding
LinkOut - more resources
Full Text Sources
Other Literature Sources
Medical

