. 2016 Jul 27:6:29749.
doi: 10.1038/srep29749.

Multiscale Cues Drive Collective Cell Migration

Affiliations

Multiscale Cues Drive Collective Cell Migration

Ki-Hwan Nam et al. Sci Rep. .

Abstract

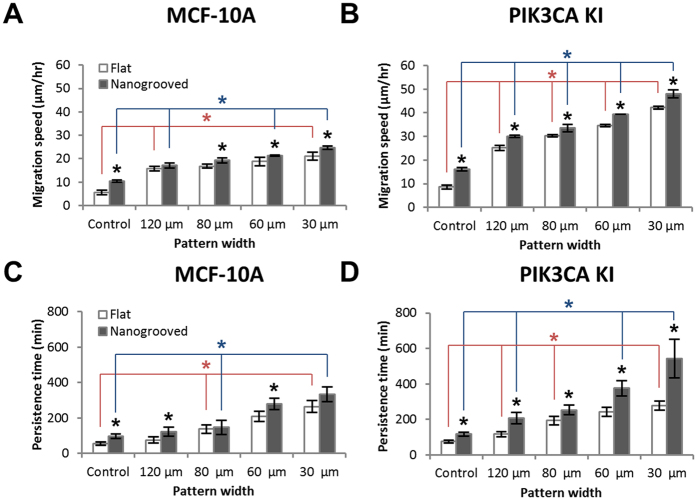
To investigate complex biophysical relationships driving directed cell migration, we developed a biomimetic platform that allows perturbation of microscale geometric constraints with concomitant nanoscale contact guidance architectures. This permits us to elucidate the influence, and parse out the relative contribution, of multiscale features, and define how these physical inputs are jointly processed with oncogenic signaling. We demonstrate that collective cell migration is profoundly enhanced by the addition of contract guidance cues when not otherwise constrained. However, while nanoscale cues promoted migration in all cases, microscale directed migration cues are dominant as the geometric constraint narrows, a behavior that is well explained by stochastic diffusion anisotropy modeling. Further, oncogene activation (i.e. mutant PIK3CA) resulted in profoundly increased migration where extracellular multiscale directed migration cues and intrinsic signaling synergistically conspire to greatly outperform normal cells or any extracellular guidance cues in isolation.


Conflict of interest statement

DHK declares a consulting role and stock ownership at NanoSurface Biomedical, Inc.

Figures

Figure 1
Figure 1. Fabrication of an engineered biomimetic culture platform.
(A) Schematic diagram of the nanofabrication of topographically patterned elastomeric substrate using UV-assisted capillary force lithography. PDMS was drop dispensed onto coverglass, and then the coverglass was embossed with PUA master mold (800 nm ridge, 800 nm groove, 600 nm height). Capillary force lithography molded PDMS into the nanogroove pattern. Careful removal of the PUA master completed the nanofabrication. A SEM image of the nanogrooved substrate is shown at the bottom. (B) Schematic illustration of surface patterning using microstamp-assisted plasma lithographic techniques and ECM coating. A microchannel-patterned PDMS stamp was fabricated using soft-lithographic techniques and molding into PDMS (step 1). The cell culture platform was prepared for plasma lithographic patterning on the substrate (step 2). Oxygen plasma treatment (indicated by pink) of the device modified the originally hydrophobic nanogroove-patterned PDMS to hydrophilic, excluding the area in contact with PDMS stamp (step 3). Collagen type I at 50 μg/mL (indicated by green) was coated on the nanogroove-patterned PDMS for 6 hours (step 4). PDMS stamp was carefully removed after dispersed cells have reached monolayer. The removal of PDMS stamp resulted in a cell culture device with various widths of protein coated micropatterns (green surface) and collagen-untreated area (brown surface) (step 5). (C) Representative fluorescent images of the 30, 60, 80, and 120 μm width patterns of collagen type I (50 μg/mL) conjugated with Alexa Fluor 488-FITC (40 μg/mL). Only plasma-treated surface of the nanogrooved substrate was uniformly coated with the collagen type I solution even the inner parts of the grooves. (D) Microscopic images of patterned MCF-10A cells on nanogroove-patterned elastomeric substrates. After the removal of the PDMS stamp, the images were captured from the time point when the cells clearly entered 150 μm into the micropatterns for 12 hrs.
Figure 2
Figure 2. Migration of straight edge patterned cells on flat and nanogroove-patterned PDMS substrate.
MCF10A wild type cells (A,B) and their mutant PIK3CA knockin cells (C,D) were patterned with a stencil after surface coating with type I collagen (50 μg/ml) on flat (A,C) and nanogrooved PDMS substrates (B,D). Scale bars = 100 μm, and an insert image (B) shows the direction of nanogrooves. Two images of straight-edged monolayers at 0 hr and 18 hrs respectively taken at the same positions combined into a single image. Yellow dot lines indicate the initial front edges of patterned cells and blue dot lines indicates the terminal front edges of migrated cells. Yellow arrows indicate a total migration distance over 18 hrs. The paths of individual migrating MCF-10A cells on flat (E) and nanogrooved (F) PDMS substrates were analyzed using custom MATLAB code. Individual migration paths of MCF-10A cells, defined as the angular deviation from the direction of nanotopography measured on both flat (G) and nanogrooved (H) substrates to assess migratory contact guidance. The portion of migration direction within ±15 degree from the nanogrooves representing straight directionality is highlighted in each graph. Migration speed (I) and persistence time (J) characterizing migratory responses of MCF-10A wild type and oncogenic PIK3CA knockin cells to substrate topography analyzed by fitting the mean-squared displacement of the cell path data to the persistent random walk model. Error bars represent standard deviations of three technical replicates with 80–100 cells per each experiment (*p < 0.01, **p < 0.001).
Figure 3
Figure 3. Cell migration on ECM patterned substrates using plasma lithographic techniques.
(A) Microscopic images of mutant PIK3CA knockin cells migration on collagen type I patterned nanogrooved PDMS substrates. Time-lapse video microscopy was used to capture the cellular motility and digital images were taken every 20 min for a total of 12 hrs per experiment. Scale bars = 100 μm. (B) The paths of individual migrating PIK3CA knockin cells on flat (B top) and nanogrooved (B bottom) migration on PDMS substrates was analyzed using custom MATLAB code. Color bar legend indicates migration speed of cells at each time-lapse in units of formula image
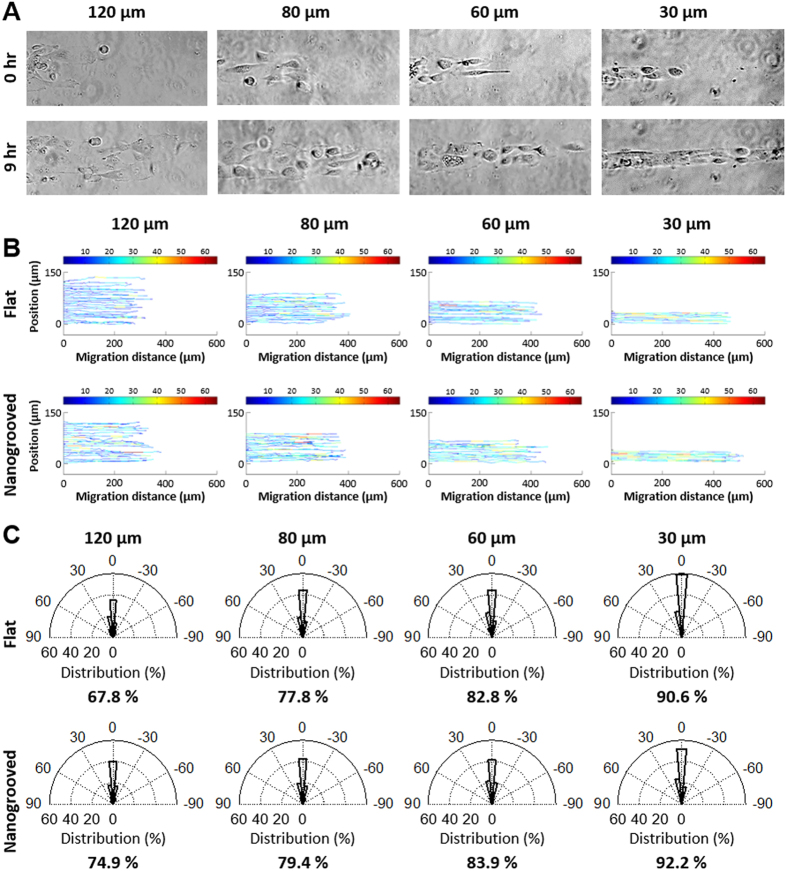
m/hr. (C) The migration direction of individual paths of PIK3CA knockin cells on both flat (C top) and nanogrooved (C bottom) substrates were measured and the portion of the migration directions within ±15 degree from the ECM patterns representing straight directionality of the migration is shown in each graph. As the ECM pattern widths became narrower from 120 μm to 30 μm, motile cells show greater straight directionality on both substrates with a decreased effect of nanotopography on migratory contact guidance.
Figure 4
Figure 4. Directed migration from microscale geometric constraints conforms to diffusion anisotropy behavior.
(A) Example of single particle (representing cells) undergoing a random walk in a geometrically constrained environment that results in increased motility coefficients, and thus mean displacements, in the x direction for a population of cells. Note, cells behind a collective migration front and lateral cell interactions further constrain the system. (B) Model output of normalized migration distance in the x direction over of a range of displacement steps with defined persistence length for a range of channel/pattern widths. Model output is from 100,000 steps/particle averaged over 1000 particles and data is normalized to random walk behavior in the unconstrained 2D configuration. (C) Normalized migration distance for four pattern widths highlighting the increase in migration along the x-direction as the geometric constraint narrows. Data are from the average of 10 runs with 300 particles undergoing 100,000 steps/particle.
Figure 5
Figure 5. Persistence random walk model parameterized by cellular migration speed and directional persistence time.
Cell migration speed of MCF-10A wild type cells (A) and oncogenic PIK3CA knockin cells (B) responsive to substrate nanotopography, and on flat and nanogrooved substrate to cell type based on ECM pattern geometry. Persistence time of MCF-10A cells (C) and oncogenic PIK3CA knockin cells (D) on ECM patterned flat and nanogrooved PDMS substrates were calculated by fitting the mean-squared displacement of cell path data to the persistent random walk model. Error bars represent standard deviations of three technical replicates with 40–50 cells per each experiment and statistical significance is indicated by P values (*p < 0.05).

References

    1. Yamada K. M. & Cukierman E. Modeling tissue morphogenesis and cancer in 3D. Cell 130, 601–610 (2007). - PubMed
    1. Provenzano P. P., Eliceiri K. W. & Keely P. J. Shining new light on 3D cell motility and the metastatic process. Trends in cell biology 19, 638–648 (2009). - PMC - PubMed
    1. Midwood K. S., Williams L. V. & Schwarzbauer J. E. Tissue repair and the dynamics of the extracellular matrix. The international journal of biochemistry & cell biology 36, 1031–1037 (2004). - PubMed
    1. Daley W. P. & Yamada K. M. ECM-modulated cellular dynamics as a driving force for tissue morphogenesis. Current opinion in genetics & development 23, 408–414 (2013). - PMC - PubMed
    1. Ingman W. V., Wyckoff J., Gouon-Evans V., Condeelis J. & Pollard J. W. Macrophages promote collagen fibrillogenesis around terminal end buds of the developing mammary gland. Developmental dynamics: an official publication of the American Association of Anatomists 235, 3222–3229 (2006). - PubMed

Publication types