. 2016 Jul 27:7:12313.
doi: 10.1038/ncomms12313.

ANGPTL4 deficiency in haematopoietic cells promotes monocyte expansion and atherosclerosis progression

Affiliations

ANGPTL4 deficiency in haematopoietic cells promotes monocyte expansion and atherosclerosis progression

Binod Aryal et al. Nat Commun. .

Abstract

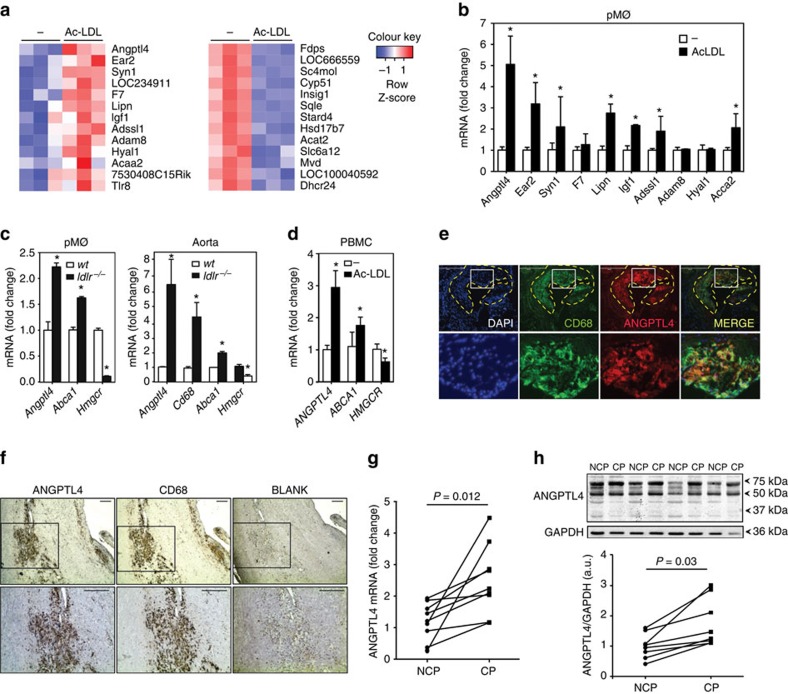
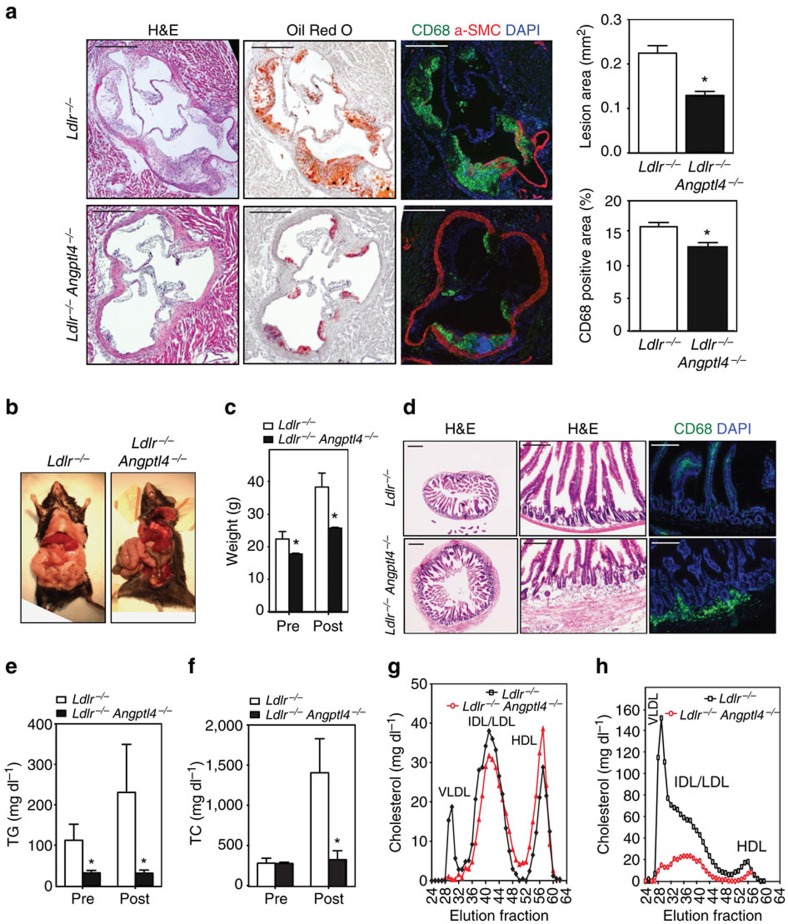
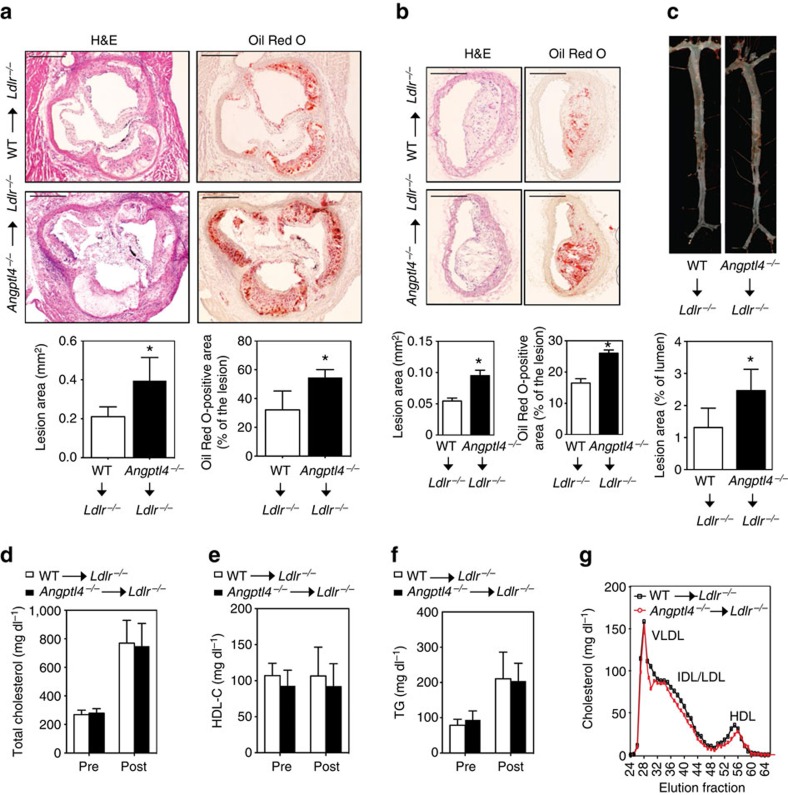
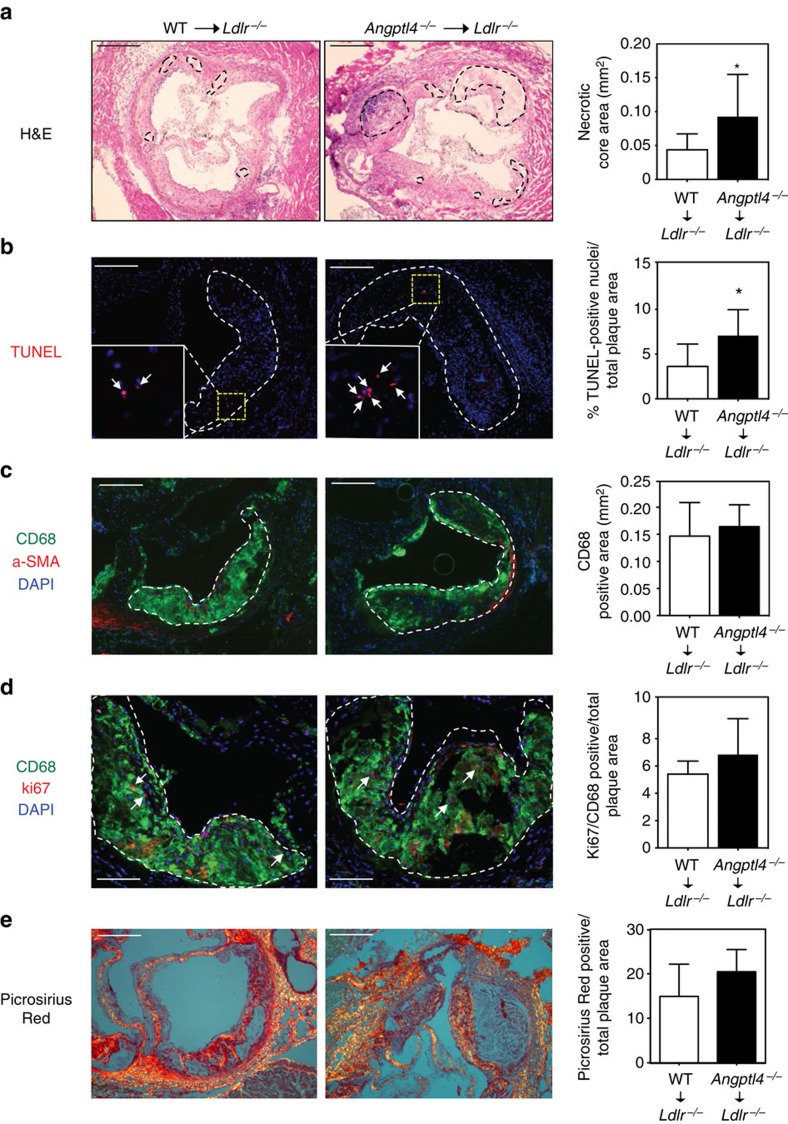
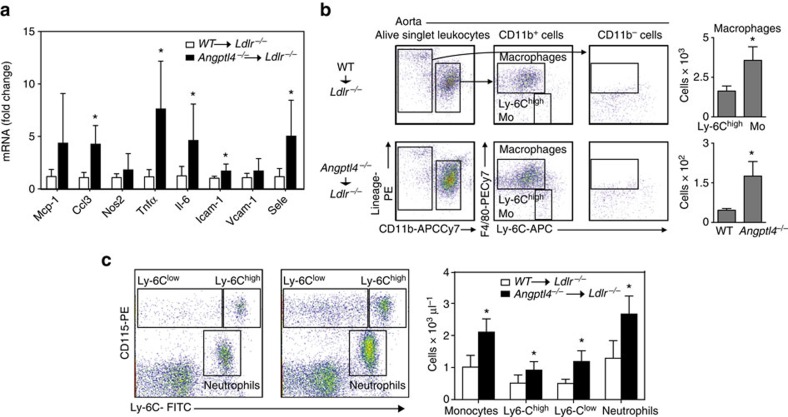
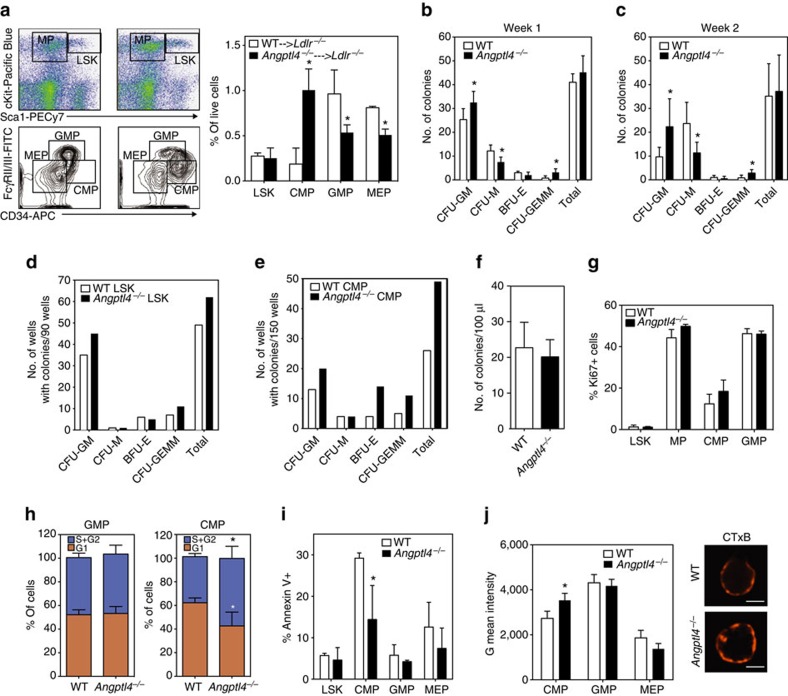
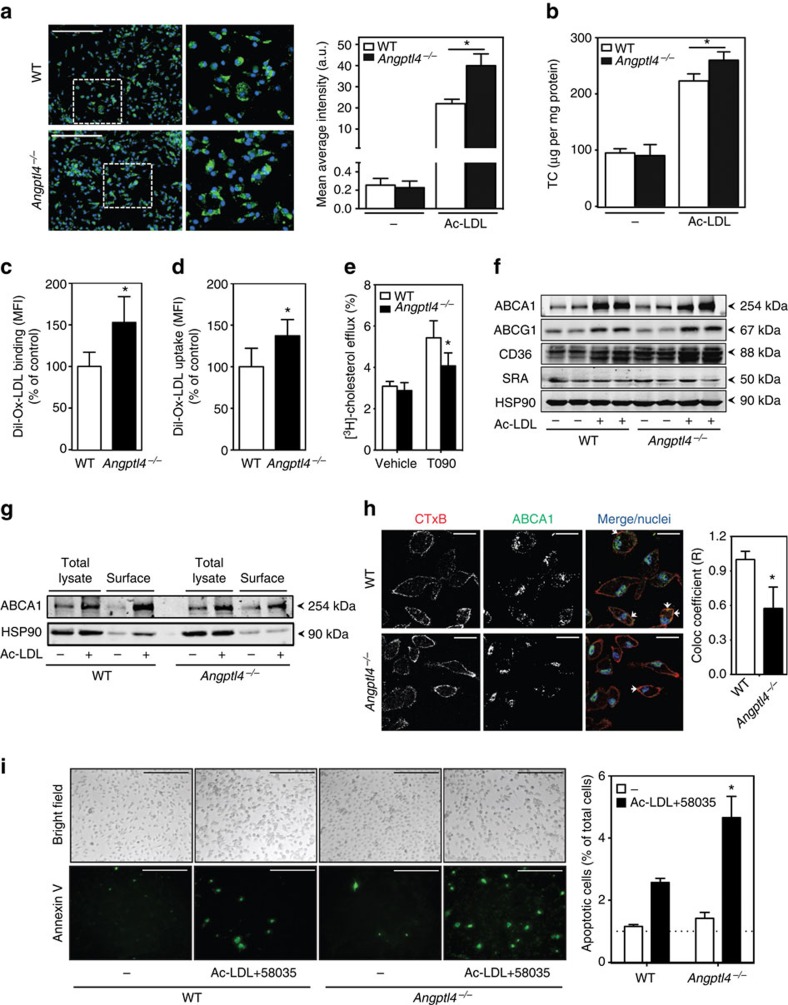
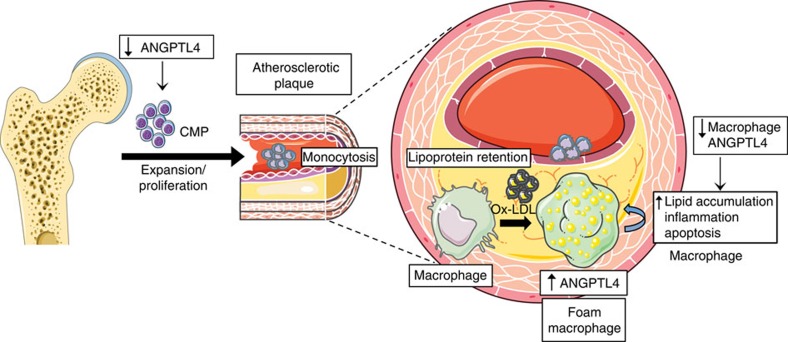
Lipid accumulation in macrophages has profound effects on macrophage gene expression and contributes to the development of atherosclerosis. Here, we report that angiopoietin-like protein 4 (ANGPTL4) is the most highly upregulated gene in foamy macrophages and it's absence in haematopoietic cells results in larger atherosclerotic plaques, characterized by bigger necrotic core areas and increased macrophage apoptosis. Furthermore, hyperlipidemic mice deficient in haematopoietic ANGPTL4 have higher blood leukocyte counts, which is associated with an increase in the common myeloid progenitor (CMP) population. ANGPTL4-deficient CMPs have higher lipid raft content, are more proliferative and less apoptotic compared with the wild-type (WT) CMPs. Finally, we observe that ANGPTL4 deficiency in macrophages promotes foam cell formation by enhancing CD36 expression and reducing ABCA1 localization in the cell surface. Altogether, these findings demonstrate that haematopoietic ANGPTL4 deficiency increases atherogenesis through regulating myeloid progenitor cell expansion and differentiation, foam cell formation and vascular inflammation.


Figures

Figure 1
Figure 1. ANGPTL4 is expressed in macrophages accumulated in atherosclerotic plaques.
(a) Heat map representation of gene expression from microarray data comparing mouse peritoneal macrophages incubated with or without Ac-LDL (120 μg ml−1) for 24 h. Left panel shows upregulated genes (P<0.05, unpaired t-test; fold change≥1.4) and right panel shows downregulated genes (P<0.05, unpaired t-test; fold change≥2.08) upon Ac-LDL treatment compared with non-treated cells. Samples were analysed in triplicate. (b) qRT-PCR validation of selected genes upregulated in the microarray in mouse peritoneal macrophages treated with or without Ac-LDL for 24 h. qRT-PCR analysis of Angptl4 expression levels in macrophages (c, left) and whole aorta (c, right) from WT and Ldlr−/− mice fed a WD (left) (n=4 per group), and in human peripheral blood mononuclear cells (d) treated with or without Ac-LDL (120 μg ml−1) for 24 h. Abca1 and Hmgcr genes were used as control genes for cholesterol loading and Cd68 was used as a marker for macrophages. All data represent the mean±s.e.m. and are representative of three experiments in duplicate; *P≤0.05 compared with untreated macrophages (b,d) and WT mice (c) by unpaired t-test. (e) Immunostaining of ANGPTL4 (red) and macrophage marker CD68 (green) and their co-localization in atherosclerotic plaques of Ldlr−/− mice fed a WD. Scale bar, 400 μm. (f) Immunohistochemistry staining of ANGPTL4 and CD68 in human atherosclerotic plaques. Scale bar, 200 μm. (g) Comparison of ANGPTL4 mRNA expression in NCP and corresponding culprit (CP) human atherosclerotic plaques (n=9). (h) Representative western blot showing comparison of ANGPTL4 expression in NCP and corresponding CP. Lower panel shows densitometry analysis for the 50 kDa bands of the western blots (n=7). *P≤0.05 compared with NCP by unpaired t-test; a.u. arbitrary units. Full scans of westerns blots are provided in Supplementary Fig. 7.
Figure 2
Figure 2. Absence of ANGPTL4 attenuates the progression of atherosclerosis.
(a) Representative histological analysis of cross-sections of the aortic sinus from Ldlr−/− and Angptl4−/−Ldlr−/− mice stained with H&E, Oil Red O and CD68/SMC-actin/DAPI. Quantification of the lesion area and macrophage content is shown in the right panels (n=9 per group). Scale bars, 400 μm. (b) Representative pictures of whole body Ldlr−/− and Angptl4−/−Ldlr−/− mice on WD diet 12 weeks. (c) Body weight analysis of Ldlr−/− and Angptl4−/−Ldlr−/− mice before and after WD diet (n=9 per group). (d) Representative histological analyses of cross-section of the ileum from Ldlr−/− and Angptl4−/−Ldlr−/− mice stained with H&E and macrophage marker CD68. Scale bars, 400 μm. (eh) Measurement of plasma TG (e), cholesterol (f) and lipoprotein profile from pooled plasma (g-h) of Ldlr−/− and Angptl4−/−Ldlr−/− mice before and after 12 weeks on WD diet (n=9 per group). All data are the mean±s.e.m.; *P<0.05 by comparison with data from Ldlr−/− mice by unpaired t-test.
Figure 3
Figure 3. Haematopoietic ANGPTL4 deficiency enhances atherogenesis.
(a,b) Representative histological analysis of cross-sections of the aortic sinus (a) and brachiocephalic arteries (b) isolated from male Ldlr−/− chimeras with WT or Angptl4−/− BM after 12 weeks of WD stained with H&E and Oil Red O. Quantification of lesion area and Oil Red O-positive lesion area is shown in the panel below respective figure (n=10 per group for aortic sinus and n=6 per group for brachiocephalic arteries). Scale bars, 400 μm. (c) Representative pictures from en face analysis of aortas from Ldlr−/− chimeras with WT or Angptl4−/− BM after 12 weeks on WD diet. Proportion of Oil Red O-positive area in the en face preparation is quantified in the lower panel (n=8 per group). Total cholesterol level (d), HDL cholesterol level (e) and TG level (f) in the blood plasma of Ldlr−/− chimeras with WT or Angptl4−/− BM before and after 12 weeks on WD (n=10 per group). (g) Lipoprotein profile from pooled plasma (n=5 each group) of Ldlr−/− chimeras with WT or Angptl4−/− BM after 12 weeks on WD diet. All data are the mean±s.e.m.; *P<0.05 by comparison with data from Ldlr−/− chimeras with WT BM by unpaired t-test.
Figure 4
Figure 4. Angptl4−/− BM recipients have more apoptosis in the atherosclerotic lesions.
(a-d) Representative histological analyses of the cross-sections of the aortic sinus from Ldlr−/− chimeras with WT or Angptl4−/− BM after 12 weeks on WD stained with (a) H&E showing necrotic areas within dotted boundary (scale bars, 400 μm), (b) TUNEL; inset shows magnified TUNEL-positive area (scale bars, 200 μm), (c) CD68/α-SMA/DAPI (scale bars, 200 μm), (d) CD68/Ki67/DAPI (scale bars, 200 μm) and (e) Picrosirius Red staining (scale bars, 200 μm). Total necrotic area, TUNEL-positive nuclei, macrophage content, Ki67-positive macrophages and collagen content are quantified in the right panels. N=10 per group for ad and n=6 per group for e. All data are the mean±s.e.m.; *P<0.05 by comparison with data from Ldlr−/− chimeras with WT BM by unpaired t-test.
Figure 5
Figure 5. Haematopoietic ANGPTL4 deficiency causes vascular inflammation and leukocytosis.
(a) mRNA expression of inflammatory genes in the whole aorta of Ldlr−/− chimeras with WT or Angptl4−/− BM after 12 weeks on WD (n=9 per group). (b) Dot plots showing gating schemes of macrophages and monocytes from whole aorta of Ldlr−/− chimeras with WT or Angptl4−/− BM after 12 weeks on WD. (right) The quantification of total number of macrophages and Ly-6Chigh monocytes (n=6 per group). (c) Representative flow cytometry plots showing monocyte and neutrophil populations from Ldlr−/− chimeras with WT or Angptl4−/− BM after 12 weeks on WD. Total monocytes and neutrophils are quantified on the right panel by extrapolating the proportion of cells from flow cytometry to the total number of leukocytes per μl measured using Hemavet haematology analyser (n=10 per group). All data are the mean±s.e.m.; *P<0.05 by comparison with data from Ldlr−/− chimeras with WT BM by unpaired t-test.
Figure 6
Figure 6. Haematopoietic ANGPTL4 deficiency promotes CMP expansion.
(a) Dot plots showing the gating scheme of MP and LSK cells (upper panel), contour plots showing the gating schemes of GMP, CMP and MEP cells (lower panel) in the BM of Ldlr−/− chimeras with WT or Angptl4−/− BM on WD for 12 weeks. Right panel shows the quantification these progenitor populations (n=5 per group). Data are mean±s.e.m. *P<0.05 by comparison with data from Ldlr−/− chimeras with WT BM by unpaired t-test. (b) Number of colonies from the BM isolated from WT and Angptl4−/− mice using CFU assay. Cells were plated in methylcellulose media for 1 week; colonies were counted (b), resuspended and plated for 1 more week (c) (n=6 per group). Number of colony positive wells from LSKs (d) and CMPs (e) sorted from the BM and plated for 10 days individually in 96 well plates cells in methylcellulose media (n=4 per group; a pool of BM was used for sorting from each group). (f) Number of colonies from 100 μl blood from WT and Angptl4−/− mice plated in methylcellulose media for 10 days (n=3 per group). (g) Proportion of Ki67-positive proliferating cells from indicated cell type from WT and Angptl4−/− BM. (h) Cell cycle analysis of GMPs and CMPs from WT and Angptl4−/− BM showing fraction of cells in G1 and S/G2 phase as determined by DAPI staining (n=5 per group). Cell cycle phase gates were drawn as approximations of the Watson (pragmatic) cell cycle modelling algorithm. (i) Proportion of annexin V positive apoptotic cells from indicated cell types from WT and Angptl4−/− BM (n=5 per group). (j) Representative fluorescent images and flow cytometry quantification of lipid raft content in CMPs of WT and Angptl4−/− BM assessed by CTxB staining (n=3 per group). Scale bars, 5 μm. All data are the mean±s.e.m. *P<0.05 by comparison with data from WT BM (b,c,h,i,j) by unpaired t-test.
Figure 7
Figure 7. ANGPTL4 deficiency promotes macrophage foam cell formation and apoptosis.
(a) Representative pictures from WT and Angptl4−/− mouse peritoneal macrophages incubated with or without Ac- LDL (120 μg ml−1) for 24 h and stained with BODIPY 493/503 (1 μg ml−1) and DAPI (Green and blue, respectively). Scale bar, 5 μm. Quantification of the mean average intensity is in the right panel. (b) Total cholesterol content in peritoneal macrophages isolated from WT and Angptl4−/− mice incubated with or without Ac-LDL (120 μg ml−1) for 24 h. (c) Flow cytometry analysis of DiI-Ox-LDL binding in peritoneal macrophages incubated with DiI-Ox-LDL (30 μg cholesterol per ml) for 30 min at 4 °C. At the end of the incubation period, cells were washed and incubated in RPMI 10% FBS media for 15 min at 37 °C to allow the internalization. (d) Flow cytometry analysis of DiI-Ox-LDL uptake in peritoneal macrophages incubated with DiI-Ox-LDL (30 μg cholesterol per ml) for 2 h at 37 °C. The results are expressed in terms of specific MFI after subtracting auto-fluorescence of cells incubated in the absence of DiI-Ox-LDL. (e) Cholesterol efflux to apolipoprotein A1 (ApoA1) in peritoneal macrophages isolated from WT and Angptl4−/− mice stimulated with or without T0901317 (T090). (f) Western blot analysis of indicated proteins in peritoneal macrophages from WT and Angptl4−/− mice incubated with or without Ac-LDL (120 μg ml−1) for 24 h. (g) Western blot analysis (representative of three blots) of ABCA1 expression in WT and Angptl4−/− peritoneal macrophages incubated with Ac-LDL for 24 h. Surface ABCA1 was isolated using biotinylation followed by incubation with neutravidin. HSP90 is used as loading control (f and g). Full scans of westerns blots are provided in Supplementary Fig. 8. (h) Representative confocal images of mouse peritoneal macrophages from WT and Angptl4−/− mice incubated with Ac-LDL for 24 h and stained with cholera toxin B (CTxB), ABCA1 and DAPI. Quantification of co-localization of CTxB and ABCA1 is on the right panel. Scale bar, 10 μm. (i) Representative images of WT and Angptl4−/− macrophages cultured on coverslips and treated with or without Ac-LDL (120 μg ml−1) in combination with ACAT inhibitor (58035) for 24 h to induce lipid-loading-induced apoptosis (scale bars, 200 μm). Apoptosis was detected using Annexin-V staining. Right panel shows the quantification of percentage of apoptotic cells from four random fields from each cover slip. All data represent the mean±s.e.m. from at least three experiments in duplicate; *P<0.05 compared with WT macrophages by unpaired t-test. MFI, median intensity of fluorescence.
Figure 8
Figure 8. ANGPTL4 deficiency results in monocytosis and massive atherosclerosis.
Schematic diagram showing haematopoietic ANGPTL4 function in atherosclerosis. ANGPTL4 is induced in macrophages in response to lipoprotein loading. ANGPTL4 deficiency in macrophages results in increase in foam cell formation, inflammation and apoptosis of macrophages within atherosclerotic plaques. Concomitantly, ANGPTL4 deficiency in haematopoietic cells results in an increase in the frequency and survival of CMPs, and upon WD feeding results in an elevated level of circulating monocytes. Overall, ANGPTL4 deficiency in haematopoietic cells promotes massive atherosclerosis.

Similar articles

Cited by

References

    1. Ross R. Atherosclerosis—an inflammatory disease. N. Engl. J. Med. 340, 115–126 (1999). - PubMed
    1. Glass C. K. & Witztum J. L. Atherosclerosis. The road ahead. Cell 104, 503–516 (2001). - PubMed
    1. Weijenberg M. P., Feskens E. J. & Kromhout D. White blood cell count and the risk of coronary heart disease and all-cause mortality in elderly men. Arterioscler. Thromb. Vasc. Biol. 16, 499–503 (1996). - PubMed
    1. Averill L. E., Meagher R. C. & Gerrity R. G. Enhanced monocyte progenitor cell proliferation in bone marrow of hyperlipemic swine. Am. J. Pathol. 135, 369–377 (1989). - PMC - PubMed
    1. Feldman D. L., Mogelesky T. C., Liptak B. F. & Gerrity R. G. Leukocytosis in rabbits with diet-induced atherosclerosis. Arterioscler. Thromb. 11, 985–994 (1991). - PubMed

Publication types

MeSH terms

Substances

LinkOut - more resources