. 2016 Jul 27:6:29876.
doi: 10.1038/srep29876.

Spatial temperature gradients guide axonal outgrowth

Affiliations

Spatial temperature gradients guide axonal outgrowth

Bryan Black et al. Sci Rep. .

Abstract

Formation of neural networks during development and regeneration after injury depends on accuracy of axonal pathfinding, which is primarily believed to be influenced by chemical cues. Recently, there is growing evidence that physical cues can play crucial role in axonal guidance. However, detailed mechanism involved in such guidance cues is lacking. By using weakly-focused near-infrared continuous wave (CW) laser microbeam in the path of an advancing axon, we discovered that the beam acts as a repulsive guidance cue. Here, we report that this highly-effective at-a-distance guidance is the result of a temperature field produced by the near-infrared laser light absorption. Since light absorption by extracellular medium increases when the laser wavelength was red shifted, the threshold laser power for reliable guidance was significantly lower in the near-infrared as compared to the visible spectrum. The spatial temperature gradient caused by the near-infrared laser beam at-a-distance was found to activate temperature-sensitive membrane receptors, resulting in an influx of calcium. The repulsive guidance effect was significantly reduced when extracellular calcium was depleted or in the presence of TRPV1-antagonist. Further, direct heating using micro-heater confirmed that the axonal guidance is caused by shallow temperature-gradient, eliminating the role of any non-photothermal effects.


Conflict of interest statement

Dr. Samarendra Mohanty is a founder of, and has an equity interest in NanoScope Technologies, LLC, which is developing products in Biomedical diagnostics and therapeutic technologies. The terms of this arrangement have been reviewed and approved by the University of Texas at Arlington in accordance with its policy on objectivity in research.

Figures
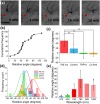
Figure 1
Figure 1. Mechanism of light-induced repulsive axonal guidance.
(a) Time-lapse images of primary cortical axon responding to asymmetrical positioning of weakly-focused (0.5 NA) laser (80 mW at 785 nm) spot (marked by red spot). Scale bar: 10 μm. (b) Cumulative frequency (in %) of relative turning angle in response to single guidance by a static laser spot. (c) Relative angle turned in the cases of positive control (785 nm, laser on, red), negative control (laser off, blue), silenced (785 nm, laser on, 10 μM SB-366791, TRPV1 antagonist, green), and calcium-free (785 nm, laser on, Ca-free medium, orange) guidance trials. Statistical significance between trial groups (**p < 0.01). Average ± S.D. (d) Frequency counts for the four major experimental groups. Lines indicate a 100% scaled normal fit. (e) Relative angle turned in response to the laser cue at various wavelengths (473, 532, 750, 785, 900, 1000 nm). *Sample-site laser power at 473, 532, or 1000 nm were <80 mW (used for 750, 785, 900 nm). Angles reported are from trials in which the axon grew to the static position of the laser spot.
Figure 2
Figure 2. Simulation of temperature increment and induced TRPV1-channel opening-probability.
(a) Temperature field plot (X, Y: in μm) for laser beam (785 nm, 80 mW) weakly-focused (0.5 NA) in water-medium. Color bar is in °C. (b) Radial line plot of temperature field due to weakly-focused (0.5 NA) laser spot at 785 nm (80 mW, green), 1000 nm (10 mW, red), and 530 nm (10 mW, blue). (c) Temperature-dependent opening-probability of TRPV1-channel for specific heat variances (ΔCp) of 8 (red), 12 (blue), 16 (green), and 20 (turquoise) kJ mol−1 K−1. (d) Zoomed region of temperature-dependent opening-probability of TRVP1 for our experimentally-relevant temperature range.
Figure 3
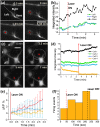
Figure 3. Calcium imaging of growth cone and soma of rat cortical neurons in response to NIR laser spot at-a-distance.
(a) Representative epifluorescence time-lapse images of cortical neuron growth cone incubated with Fluo-3 AM (5 μM) and exposed to 1064 nm (10 mW) focused (1.3 NA) laser spot at-a-distance (marked by red dot). Left, right, and base of the growth cone shown in first panel. Scale bar: 10 μm. (b) Dynamics of fluorescence intensity integrated over three regions of interest (left, right, and central base) within the growth cone in response to laser spot at-a-distance. (c) Time-lapse fluorescence images of four cortical neurons (denoted by 1–4) incubated with Fluo-3 AM (5 μM) and exposed to 1064 nm (10 mW) focused (1.3 NA) laser spot at-a-distance (marked by red spot). (d) Dynamics of fluorescence intensity integrated over ROIs of equal area in the soma of the four cortical neurons before and after exposure to laser spot. Laser-on time indicated with red line. (e) Kinetics of fractional percentage change in integrated fluorescence intensity (ΔF/F %) for ROIs in cortical neurons in response to laser spot (1064 nm, 10 mW, 1.3 NA) for three different neuronal regions from the laser spot (distance: 0–10 μm, red; 10–20 μm, blue; >20 μm, orange). The dotted circle in panel c represents region within distance of 0–10 μm from the laser spot. N = 11. Average ± S.D. (f) Change in firing rate (measured by calcium fluorescence spikes) in response to laser spot at-a-distance (10 mW, 1000 nm).
Figure 4
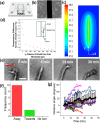
Figure 4. Direct heating induced shallow temperature gradient leads to axonal repulsion.
(a) Illustration of titanium micro-heating device and PDMS confinement well (not to scale). (b) Phase contrast image of cultured primary cortical neurons near titanium heating element (60 μm width, central vertical black strip). (c) Simulation of temperature field plot (in XY) after passing 1 mA current through a titanium heater (60 μm width) submerged in medium (water). (d) Line profile (along X) of temperature-difference across growth cone (width assumed to be 20 μm) versus distance from the titanium micro-heating element. Inset: Axon growing parallel to heating element, left side of the growth cone is at distance (X0–10) μm and right side is at (X0+10) μm. (e) Representative time-lapse phase contrast (20x) images of axonal repulsion in response to temperature rise of 1 °C at heater-medium interface (out of the field of view at a distance of 200 μm to the left). The red arrow indicates direction of high to low temperature. (f) Frequency count for advancing axons turning away from the micro-heater, towards the micro-heater, or which exhibited no turn (<10 degrees). (g) Kinetics of turning angle for advancing axons during direct heating experiments. N = 12, Average ± S.D. (black circles and error bars). Individual axons represented by other colors.

References

    1. Ming G. L. et al.. Adaptation in the chemotactic guidance of nerve growth cones. Nature 417, 411–418 (2002). - PubMed
    1. Patel N. B. & Poo M. M. Perturbation of the direction of neurite growth by pulsed and focal electric fields. J Neurosci 4, 2939–2947 (1984). - PMC - PubMed
    1. Mohanty S. K., Sharma M., Panicker M. M. & Gupta P. K. Controlled induction, enhancement, and guidance of neuronal growth cones by use of line optical tweezers. Opt Lett 30, 2596–2598 (2005). - PubMed
    1. Zheng J. Q. Turning of nerve growth cones induced by localized increases in intracellular calcium ions. Nature 403, 89–93 (2000). - PubMed
    1. Blau A. et al.. Promotion of neural cell adhesion by electrochemically generated and functionalized polymer films. J Neurosci Meth 112, 65–73 (2001). - PubMed

Publication types

LinkOut - more resources