. 2017 May 20;26(15):849-863.
doi: 10.1089/ars.2016.6662. Epub 2016 Sep 8.

Loss of NAD-Dependent Protein Deacetylase Sirtuin-2 Alters Mitochondrial Protein Acetylation and Dysregulates Mitophagy

Affiliations

Loss of NAD-Dependent Protein Deacetylase Sirtuin-2 Alters Mitochondrial Protein Acetylation and Dysregulates Mitophagy

Guoxiang Liu et al. Antioxid Redox Signal. .

Abstract

Aims: Sirtuins connect energy generation and metabolic stress to the cellular acetylome. Currently, only the mitochondrial sirtuins (SIRT3-5) and SIRT1 have been shown to direct mitochondrial function; however, Aims: NAD-dependent protein deacetylase sirtuin-2 (SIRT2), the primary cytoplasmic sirtuin, is not yet reported to associate with mitochondria.

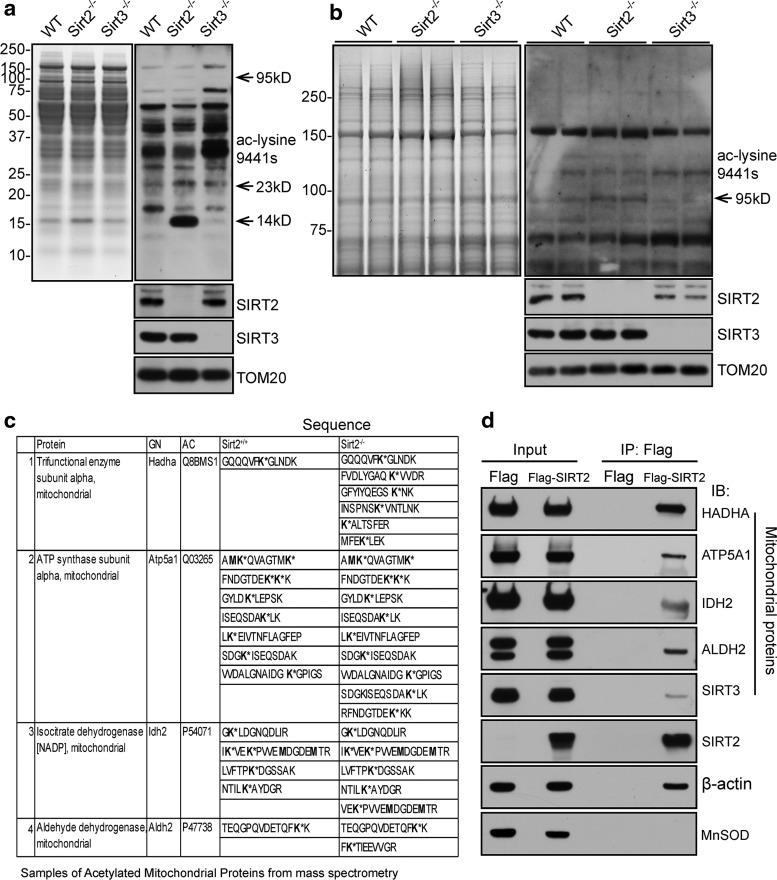
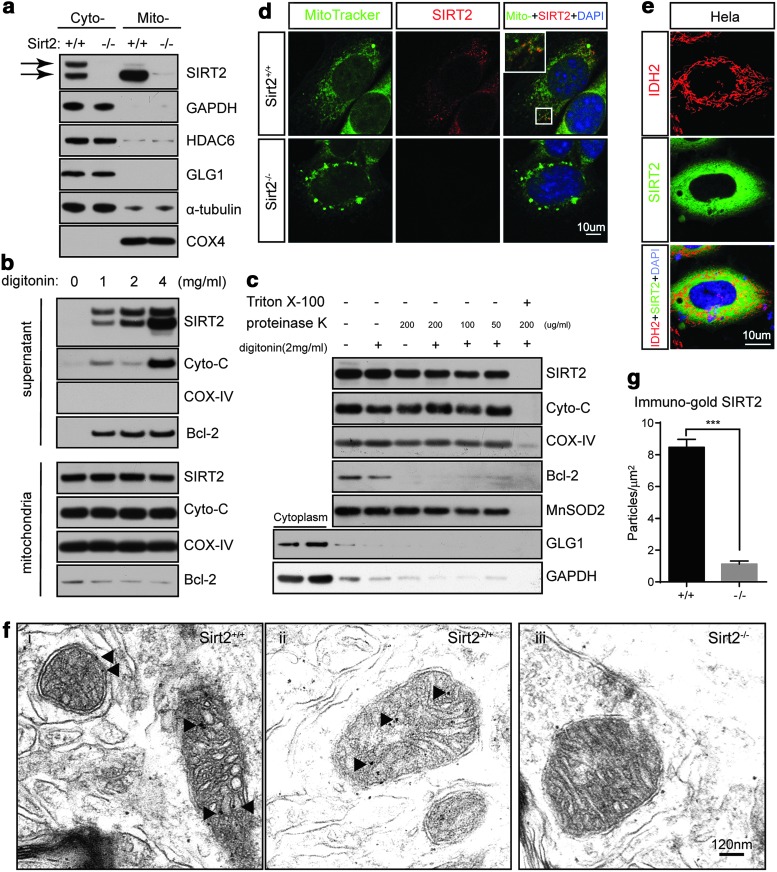
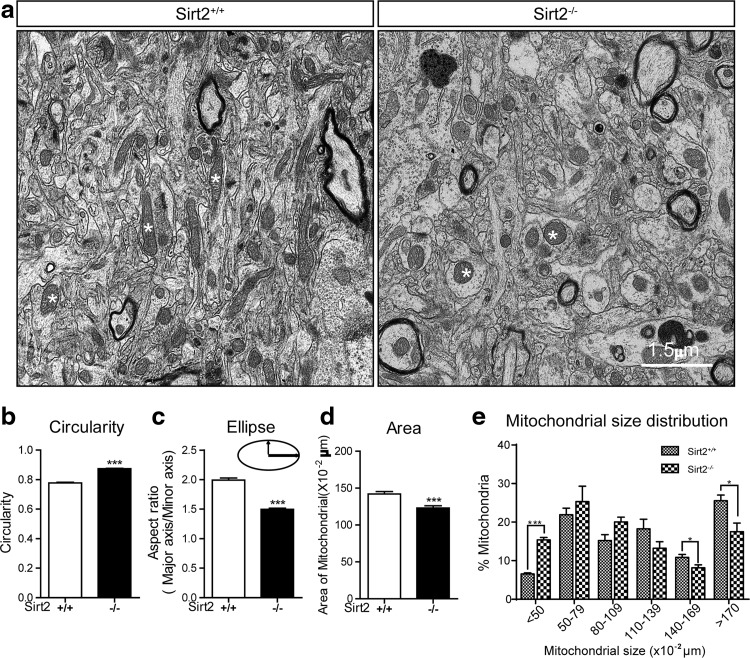
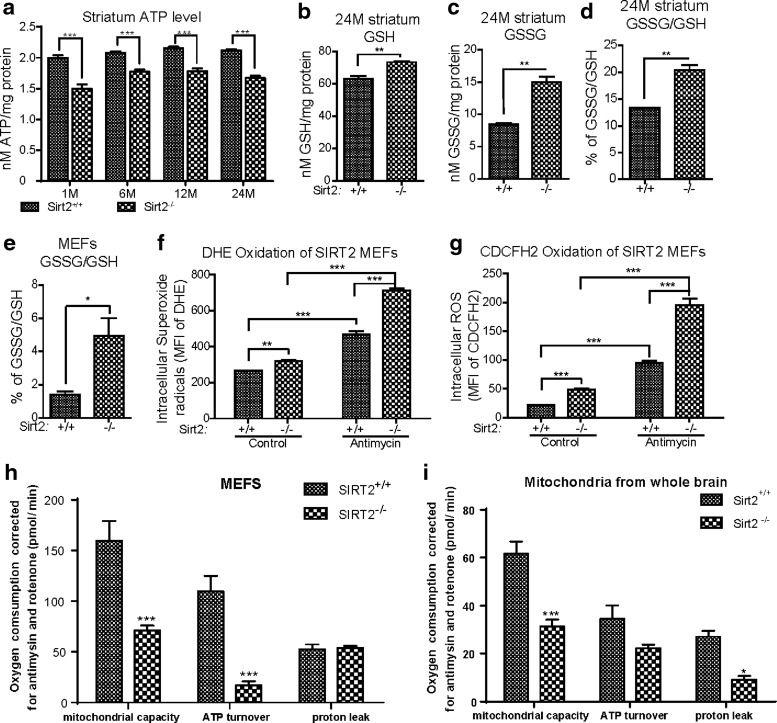
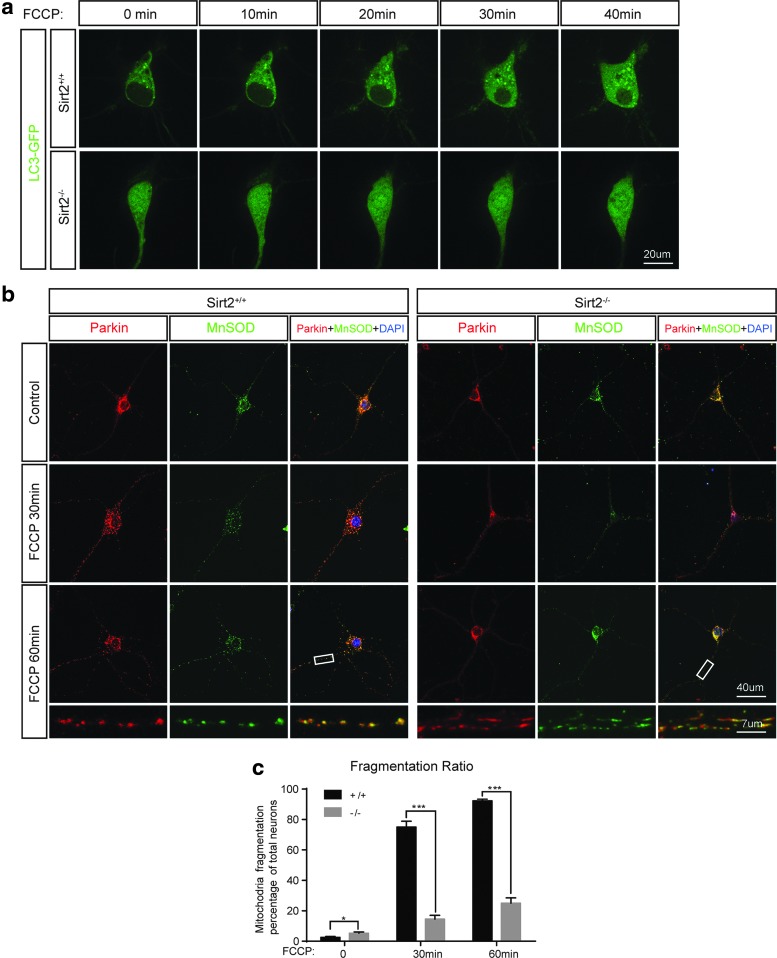
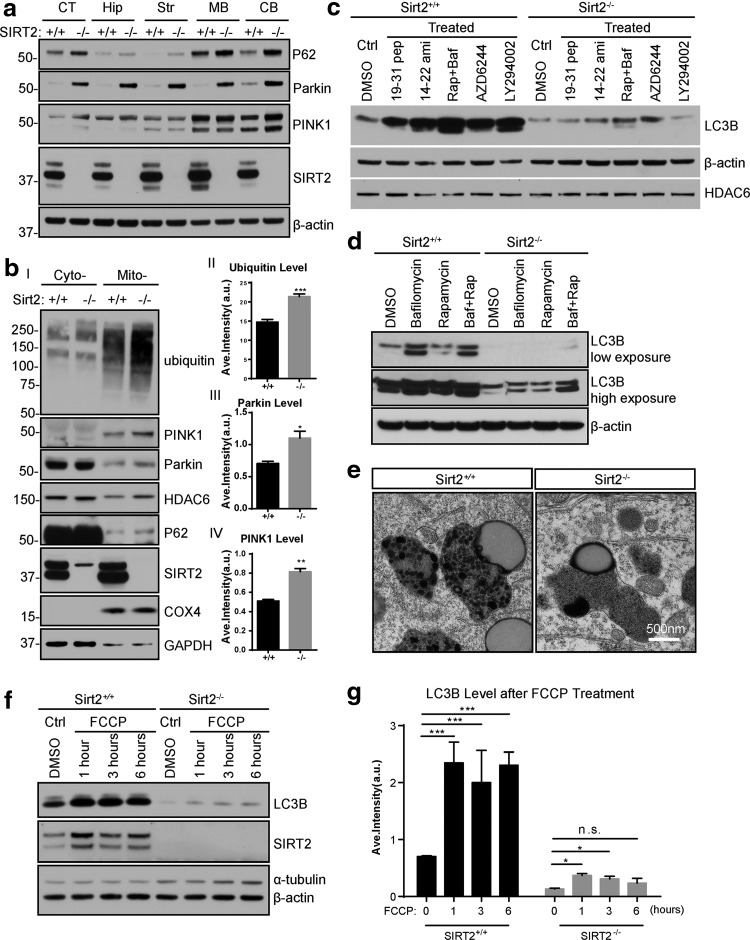
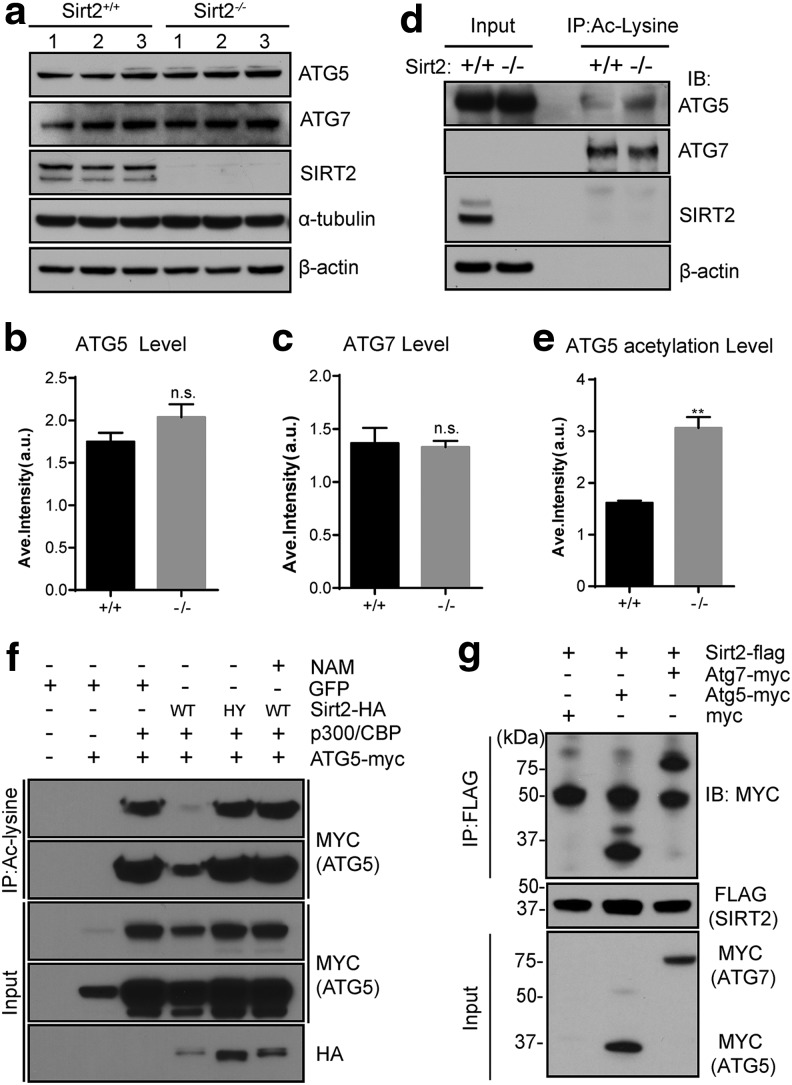
Results: This study revealed a novel physiological function of SIRT2: the regulation of mitochondrial function. First, the acetylation of several metabolic mitochondrial proteins was found to be altered in Sirt2-deficient mice, which was, subsequently, validated by immunoprecipitation experiments in which the acetylated mitochondrial proteins directly interacted with SIRT2. Moreover, immuno-gold electron microscopic images of mouse brains showed that SIRT2 associates with the inner mitochondrial membrane in central nervous system cells. The loss of Sirt2 increased oxidative stress, decreased adenosine triphosphate levels, and altered mitochondrial morphology at the cellular and tissue (i.e., brain) level. Furthermore, the autophagic/mitophagic processes were dysregulated in Sirt2-deficient neurons and mouse embryonic fibroblasts.

Innovation: For the first time it is shown that SIRT2 directs mitochondrial metabolism.

Conclusion: Together, these findings support that SIRT2 functions as a mitochondrial sirtuin, as well as a regulator of autophagy/mitophagy to maintain mitochondrial biology, thus facilitating cell survival. Antioxid. Redox Signal. 26, 849-863.

Keywords: ROS; SIRT2; autophagy; metabolism; mitochondria; mitophagy; sirtuins.


Conflict of interest statement

No competing financial interest exist.

Figures

<b>FIG. 1.</b>
FIG. 1.
The loss of Sirt2 alters the acetylation level of mitochondrial proteins. (a, b) Mitochondrial extracts from the striatum of isogenic, matched 6 month-old wild-type and Sirt2−/− mice, as well as from mice lacking Sirt3 as a control, were separated by SDS-PAGE and either stained with Coomassie blue (left panel) or immunoblotted with pan anti-acetyl (Cell Signaling, Inc.), SIRT2, and SIRT3 antibodies. TOM20 was used as the loading control. To better visualize the band at 95 kDa, the samples from (a) and one more set sample were loaded on the gel (b) with a longer running time and longer exposure. (c) Candidate mitochondrial proteins exhibit higher acetylation in Sirt2−/− as compared with the wild-type samples. Acetylated peptides found in Sirt2 wild-type and knockout MEF extracts after mass spectrometry. (d) Lysates from 293T cells infected with Flag-only or Flag-SIRT2 were harvested, IPed with an anti-Flag antibody, and, subsequently, immunoblotted with antibodies against HADHA, ATP5A1, IDH2, ALDH2, SIRT3, SIRT2, or MnSOD. β-Actin was used as the loading control. All experiments were done in triplicate. Representative images are shown. ALDH2, aldehyde dehydrogenase; ATP5A1, ATP synthase subunit alpha; HADHA, trifunctional enzyme subunit alpha; IDH2, isocitrate dehydrogenase 2 (NADP+); IP, immunoprecipitation; MEF, mouse embryonic fibroblast; MnSOD, manganese superoxide dismutase; SDS-PAGE, sodium dodecyl sulfate-polyacrylamide gel electrophoresis; SIRT2, NAD-dependent protein deacetylase sirtuin-2; TOM20, mitochondrial import receptor subunit TOM20.
<b>FIG. 2.</b>
FIG. 2.
Mitochondrial localization of SIRT2. (a) Cytoplasmic and mitochondrial fractions were isolated from the CNS cortex Sirt2+/+ and Sirt2−/− mice at 24 months of age. Samples were subsequently separated and immunoblotted with anti-SIRT2, COX-4, GLG1, and HDAC6 antibodies. GAPDH and α-tubulin were used as the loading control. (b) Mitochondria fractions were treated with digitonin in Hypotonic buffer at 1, 2, and 4 mg/ml 10 min on ice. The supernatants [(b), top] and mito-pellets [(b), bottom] were collected and Western blot was performed with SIRT2, cytochrome C, Bcl-2, and COX-IV. (c) Mitochondria were treated with digitonin (2 mg/ml) and followed by the proteinase K assay. Mito-pellets were collected and immunoblotted with anti-SIRT2, cytochrome C (intermembrane space), COX-IV (matrix), Bcl-2 (outer mitochondrial membrane), MnSOD (matrix), GLG1 (Golgi), and GAPDH. (d) Wild-type and Sirt2−/− MEFs were stained with MitoTracker as well as SIRT2 and DAPI, and representative IFC images are shown. Scale bar: 10 μm. (e) HeLa cells were stained with anti-IDH2 (to visualize mitochondria) and SIRT2 antibodies as well as DAPI, and representative IFC images are shown. Scale bar: 10 μm. (f) Sections from the neocortex of wild-type and Sirt2−/− mice stained with rabbit anti-SIRT2 (Proteintech) antibody and donkey anti-rabbit immunoglobulin G conjugated onto 10-nm gold particles followed by immunoelectron microscopy. Arrowheads point to the inner membrane. Scale bars: 120 nm. All experiments were done in triplicate. Representative images are shown. (g) Immunogold particles were counted from at least six electron microscopy images for each genotype. Error bars represent one standard deviation from the mean. ***p < 0.001. CNS, central nervous system; DAPI, 4′,6-diamidino-2-phenylindole; IFC, immunofluorescent.
<b>FIG. 3.</b>
FIG. 3.
Loss of Sirt2 makes mitochondria rounder and smaller relative to controls. (a) Electron micrograph of mitochondria in neocortex of isogenic, 24 month-old wild-type and Sirt2−/− mice. Asterisks point to representative mitochondria. Scale bar: 1.5 μm. (b–d) Bar graph depicts the quantification of mitochondrial circularity, aspect ratio (ellipticity), and total area (n = 3 animals per genotype; n > 250 mitochondria per animal). (e) Histogram of mitochondrial size distribution in μm: (i) <50 × 10−2, (ii) 50–79 × 10−2, (iii) 60–109 × 10−2, (iv) 110–139 × 10−2, (v) 140–169 × 10−2, and (vi) >170 × 10−2. Data presented are the mean ± SEM (n > 800 for each genotype). *p < 0.05, ***p < 0.001. All experiments were done in triplicate. Representative images are shown. Error bars represent SEM. SEM, standard error of the mean.
<b>FIG. 4.</b>
FIG. 4.
Loss of Sirt2 both in vitro and in vivo significantly increases oxidative stress as well as decreases cellular ATP. (a) The CNS striata from wild-type (Sirt2+/+) and Sirt2−/− mice at 1, 6, 12, and 24 months of age were harvested and used to determine ATP levels as previously shown. (b–d) The CNS striatum samples from Sirt2+/+ and Sirt2−/− mice at 24 months of age were also used to determine (b) GSH levels, (c) GSSG levels, and (d) the GSH/GSSG ratio. (e) Sirt2+/+ and Sirt2−/− MEFs were isolated, and GSH and GSSG levels were measured and, subsequently, used to determine the GSH/GSSG ratio. (f) Sirt2+/+ and Sirt2−/− MEFs without or with exposure to 5 μM of antimycin for 3 h were isolated, and superoxide levels were monitored by DHE oxidation as compared with control, untreated cells (Cont). For all DHE oxidation experiments, the results were the normalized MFI for three independent replicates. (g) Sirt2+/+ and Sirt2−/− MEFs without or with exposure to 5 μM of antimycin for 3 h were isolated, and CDCFH2 oxidation was determined as previously shown. All experiments were done in triplicate. Error bars represent one standard deviation from the mean. *p < 0.05, **p < 0.01, and ***p < 0.001. (h, i) Sirt2 deletion decreases mitochondrial ATP turnover, mitochondrial respiration capacity, and proton leak in Sirt2−/− MEFs cells and isolated mitochondria. Fifty thousand cells or equal concentrations of isolated mitochondrial pellets from whole brains were plated on a 24-well XF24 cell culture microplate overnight. Oligomycin, CCCP, and antimycin/rotenone mixture were sequentially added to measure OCR in the XF24 analyzer from Seahorse Bioscience (n = 5). The basal respiration rate was determined by the difference between the starting OCR and the OCR after adding antimycin/rotenone mixture. The ATP turnover rate was determined by the difference between the starting OCR and the OCR after adding oligomycin. The proton leak rate was determined by the difference between the OCR after adding oligomycin and the OCR after adding antimycin/rotenone mixture. Error bars represent one standard deviation from the mean. ***p < 0.001. ATP, adenosine triphosphate; CCCP, carbonyl cyanide m-chlorophenyl hydrazone; CDCFH2, 5-(and-6)-carboxy-2′,7′-dichlorodihydrofluorescein diacetate; DHE, dihydroethidium; GSH, glutathione; GSSG, oxidized glutathione; MFI, mean fluorescence intensity; OCR, oxygen consumption rate.
<b>FIG. 5.</b>
FIG. 5.
Loss of Sirt2 impairs LC3B and Parkin recruitment in primary neurons. (a) Primary hippocampal neurons from Sirt2+/+ and Sirt2−/− P0 pups were transiently transfected with GFP–LC3B and treated with 10 nM FCCP for up to 1 h, followed by live imaging both before and after treatment via immunofluorescence microscopy. (b) Primary hippocampal neurons from Sirt2+/+ and Sirt2−/− P0 pups were treated with 10 nM FCCP for 30 min and 60 min, and they were subjected to immunofluorescence staining and microscopy. Mitochondria were visualized by MnSOD (green). Scale bar: 40 μm (top three panels) or 7 μm (bottom panel). All experiments were done in triplicate. Representative images are shown. (c) Percentage of primary hippocampus neurons with mitochondrial fragmentation after FCCP for 30 min or 60 min treatment. Five independent Sirt2+/+ and Sirt2−/− cultures per condition were analyzed. *p < 0.05, ***p < 0.001. FCCP, carbonyl cyanide-4-(trifluoromethoxy) phenylhydrazone; GFP, green fluorescent protein; LC3B, microtubule-associated protein 1 light chain 3 beta; Parkin, E3 ubiquitin-protein ligase parkin.
<b>FIG. 6.</b>
FIG. 6.
Loss of Sirt2 impairs mitophagy in mice and MEFs. (a) Brains of wild-type and Sirt2-/- mice were harvested (CT, cortex; Hip, hippocampus; Str, striatum; MB, mid-brain; and CB, cerebellum) and immunoblotted with anti-P62, Parkin, PINK1, and SIRT2 antibodies. β-actin was used as the loading control. (b) Wild-type and Sirt2−/− cytoplasmic and mitochondrial brain fractions were harvested and, subsequently, immunoblotted with anti-ubiquitin, PINK1, Parkin, HDAC6, P62, SIRT2, and COX-IV antibodies. GAPDH was used as the loading control. Bar graph quantifies the relative expression levels of ubiquitin (II), Parkin (III), and PINK1 (IV). N = 3 per genotype. *p < 0.05, **p < 0.01, and ***p < 0.001. (c) Wild-type and Sirt2−/− MEFs were treated with agents that inhibit: (i) protein kinase C (19–31 pep-Protein kinase C Fragment 19–31 Amid); (ii) protein kinase A (14–22 ami-Protein Kinase A inhibitor fragment 14–22); (iii) mTOR (Rap-Rapamycin); (iv) vacuolar H+ ATPase (Baf-Bafilomycin A1); (v) MAPK/ERK kinase (AZD6244-Selumetinib); and (vi) phosphoinositide 3-kinase (LY294002). Samples were harvested after 4 h, and extracts were immunoblotted with anti-LC3B. β-Actin and HDAC6 were used as the loading control. (d) Sirt2+/+ and Sirt2−/− MEFs were treated with Bafilomycin A1, Rapamycin, or both (Baf+Rap) and harvested, and after 4 h, extracts were immunoblotted with anti-LC3B. β-Actin was used as the loading control. (e) Neocortex sections from brains of wild-type and Sirt2−/− 24 month-old isogenic, matched mice. An electron micrograph of residual bodies (lipofuscin granules) is shown. Scale bars: 500 nm. All experiments were done in triplicate. Representative images are shown. (f) Wild-type and Sirt2−/− MEFs were treated with FCCP for 1, 3, and 6 h, harvested, and immunoblotted with anti-LC3B, SIRT2 antibodies. α-Tubulin was used as the loading control. (g) Bar graphs quantify the relative expression levels of LC3B. N = 3. *p < 0.05, ***p < 0.001. n.s., non-significant; PINK1, serine/threonine-protein kinase PINK1.
<b>FIG. 7.</b>
FIG. 7.
ATG5 can interact with and is deacetylated by SIRT2. (a) Sirt2+/+ and Sirt2−/− MEF protein extracts were separated by SDS-PAGE and immunoblotted with anti-ATG5, ATG7, and SIRT2 antibodies. β-Actin and α-tubulin were used as the loading control. (b) Bar graphs quantify the relative expression levels of ATG5. N = 3. (c) Bar graphs quantify the relative expression levels of ATG7. N = 3. (d) Whole brain lysates from Sirt2+/+ and Sirt2-/- mice were harvested, IPed with an anti-acetyl lysine antibody, and, subsequently, immunoblotted with anti-ATG5, ATG7, and SIRT2 antibodies. β-Actin was used as the loading control. (e) Bar graphs quantify the relative ATG5 acetylation levels. N = 3. **p < 0.01. (f) SIRT2 deacetylates ATG5 in vitro. HEK 293T cells were transfected with wild-type HA-SIRT2 or the deacetylation null mutant (HA-SIRT2-HY) gene, p300/CBP, and/or ATG5-myc, and 48 h later, protein extracts were harvested. Lysates were, subsequently, IPed with a pan-anti-acetyl-lysine antibody and immunoblotted with anti-MYC and HA antibodies. (g) SIRT2 physically interacts with ATG5 and ATG7. HEK 293T cells were transiently transfected to express Flag-tagged SIRT2 and Myc-tagged ATG5 or ATG7 or Myc-only plasmid, and cell extracts were IPed with an anti-Flag antibody and immunoblotted with an anti-Myc antibody. All experiments were done in triplicate. Representative images are shown. ATG5, autophagy protein 5; ATG7, autophagy protein 5.

References

    1. Aquilano K, Vigilanza P, Baldelli S, Pagliei B, Rotilio G, and Ciriolo MR. Peroxisome proliferator-activated receptor gamma co-activator 1alpha (PGC-1alpha) and sirtuin 1 (SIRT1) reside in mitochondria: possible direct function in mitochondrial biogenesis. J Biol Chem 285: 21590–21599, 2010 - PMC - PubMed
    1. Balaban RS, Nemoto S, and Finkel T. Mitochondria, oxidants, and aging. Cell 120: 483–495, 2005 - PubMed
    1. Beirowski B, Gustin J, Armour SM, Yamamoto H, Viader A, North BJ, Michan S, Baloh RH, Golden JP, Schmidt RE, Sinclair DA, Auwerx J, and Milbrandt J. Sir-two-homolog 2 (Sirt2) modulates peripheral myelination through polarity protein Par-3/atypical protein kinase C (aPKC) signaling. Proc Natl Acad Sci U S A 108: E952–E961, 2011 - PMC - PubMed
    1. Chalkiadaki A. and Guarente L. The multifaceted functions of sirtuins in cancer. Nat Rev Cancer 15: 608–624, 2015 - PubMed
    1. Choudhary C, Kumar C, Gnad F, Nielsen ML, Rehman M, Walther TC, Olsen JV, and Mann M. Lysine acetylation targets protein complexes and co-regulates major cellular functions. Science 325: 834–840, 2009 - PubMed