. 2016 Jul 26;7(4):e00949-16.
doi: 10.1128/mBio.00949-16.

Unlocking the Constraints of Cyanobacterial Productivity: Acclimations Enabling Ultrafast Growth

Affiliations

Unlocking the Constraints of Cyanobacterial Productivity: Acclimations Enabling Ultrafast Growth

Hans C Bernstein et al. mBio. .

Abstract

Harnessing the metabolic potential of photosynthetic microbes for next-generation biotechnology objectives requires detailed scientific understanding of the physiological constraints and regulatory controls affecting carbon partitioning between biomass, metabolite storage pools, and bioproduct synthesis. We dissected the cellular mechanisms underlying the remarkable physiological robustness of the euryhaline unicellular cyanobacterium Synechococcus sp. strain PCC 7002 (Synechococcus 7002) and identify key mechanisms that allow cyanobacteria to achieve unprecedented photoautotrophic productivities (~2.5-h doubling time). Ultrafast growth of Synechococcus 7002 was supported by high rates of photosynthetic electron transfer and linked to significantly elevated transcription of precursor biosynthesis and protein translation machinery. Notably, no growth or photosynthesis inhibition signatures were observed under any of the tested experimental conditions. Finally, the ultrafast growth in Synechococcus 7002 was also linked to a 300% expansion of average cell volume. We hypothesize that this cellular adaptation is required at high irradiances to support higher cell division rates and reduce deleterious effects, corresponding to high light, through increased carbon and reductant sequestration.

Importance: Efficient coupling between photosynthesis and productivity is central to the development of biotechnology based on solar energy. Therefore, understanding the factors constraining maximum rates of carbon processing is necessary to identify regulatory mechanisms and devise strategies to overcome productivity constraints. Here, we interrogate the molecular mechanisms that operate at a systems level to allow cyanobacteria to achieve ultrafast growth. This was done by considering growth and photosynthetic kinetics with global transcription patterns. We have delineated putative biological principles that allow unicellular cyanobacteria to achieve ultrahigh growth rates through photophysiological acclimation and effective management of cellular resource under different growth regimes.


Figures

FIG 1
FIG 1
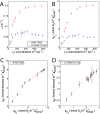
Steady-state growth and photosynthesis values of Synechococcus 7002 and Cyanothece 51142 controlled at different incident irradiances. (A) Specific growth rates of Synechococcus 7002 (SYN 7002) (red circles) and Cyanothece 51142 (CYANO 51142) (blue squares). (B) Net specific O2 production rates (i.e., net oxygenic photosynthesis) of Synechococcus 7002 and Cyanothece 51142. (C and D) Net specific rates of biomass production on a carbon mole basis (qX) plotted against the net oxygenic photosynthesis (qO2) for Synechococcus 7002 (C) and Cyanothece 51142 (D). The slopes represent the net growth-to-photosynthesis yield (Q) corresponding to either the light-limited phase (pink line) or the light-saturated phase (red line). Values are means ± 1 standard deviation (error bars).
FIG 2
FIG 2
Photosynthesis parameters determined by chlorophyll fluorescence methods. (A) Surrogate rate of cyclic electron flow (rCEF); (B) relative maximum electron transport rate (rETRmax); (C) relative maximal quantum yield of photochemistry (αr). Data points specific to Synechococcus 7002 and Cyanothece 51142 are represented by red circles and blue squares, respectively. Linear regression was used to establish positive or negative trends of each parameter during light-limited growth (solid lines), saturated/peak growth (dotted lines), and photoinhibited growth (dashed lines). f.u., fluorescence units; r.u., relative units.
FIG 3
FIG 3
Relative responses of specific growth rate to combinatorial increases in oxygen tension (i.e., partial pressures, pO2) and incident irradiance. Data are represented as the percent decrease from the baseline growth obtained by sparging the cultures with 2% CO2 in N2. (A) Synechococcus 7002 oxygen stress profile containing low-light (LL), medium-light (ML), and high-light (HL) conditions corresponding to incident irradiance values of 99, 132, and 760 µmol photons m−2 s−1. (B) Cyanothece 51142 oxygen stress profile reporting LL, ML, and HL conditions corresponding to incident irradiance values of 131, 395, and 790 µmol photons m−2 s−1.
FIG 4
FIG 4
Hierarchical clustering of relative transcript abundances in Synechococcus 7002 during steady-state turbidostat growth as a function of incident irradiance. The major clusters of coexpressed genes are color coded as follows. Cluster I genes are shown in black (809 genes), cluster II genes are shown in dark blue (724 genes), cluster III genes are shown in green (648 genes), and cluster IV genes are shown in light blue (551 genes). The full 2,732-gene list of the relative expression values at each steady state is given in Table S1 in the supplemental material. (B) The eigenvector profiles of the four main clusters of differentially expressed genes. The same color coding used for panel A is used for panel B.
FIG 5
FIG 5
Increase in average cell volumes of Synechococcus 7002 cells as a function of irradiance-driven specific growth rates. The volumes were calculated for steady-state cultures grown at Ii values of 66 (A), 98 (B), and 395 (C) µmol photons ⋅ m−2 ⋅ s−1 and represent an average of 104, 107, and 65 individual cell measurements, respectively. The cells were visualized by autofluorescence (red) and SYBR gold (green). Micrograph images representative of each condition were standardized by the bar.

References

    1. Raven JA. 2011. The cost of photoinhibition. Physiol Plant 142:87–104. doi:10.1111/j.1399-3054.2011.01465.x. - DOI - PubMed
    1. Arnon DI, Whatley FR, Allen MB. 1954. Photosynthesis by isolated chloroplasts. II. Photosynthetic phosphorylation, the conversion of light into phosphate bond energy. J Am Chem Soc 76:6324–6329. doi:10.1021/ja01653a025. - DOI
    1. Calvin M, Benson AA. 1948. The path of carbon in photosynthesis. Science 107:476–480. doi:10.1126/science.107.2784.476. - DOI - PubMed
    1. Gubernator B, Bartoszewski R, Kroliczewski J, Wildner G, Szczepaniak A. 2008. Ribulose-1,5-bisphosphate carboxylase/oxygenase from thermophilic cyanobacterium Thermosynechococcus elongatus. Photosynth Res 95:101–109. doi:10.1007/s11120-007-9240-7. - DOI - PubMed
    1. MacKenzie TDB, Campbell DA. 2005. Cyanobacterial acclimation to rapidly fluctuating light is constrained by inorganic carbon status. J Phycol 41:801–811. doi:10.1111/j.1529-8817.2005.00096.x. - DOI

Publication types