. 2016 Jul 27;8(1):80.
doi: 10.1186/s13073-016-0335-7.

Single-cell TCRseq: paired recovery of entire T-cell alpha and beta chain transcripts in T-cell receptors from single-cell RNAseq

Affiliations

Single-cell TCRseq: paired recovery of entire T-cell alpha and beta chain transcripts in T-cell receptors from single-cell RNAseq

David Redmond et al. Genome Med. .

Abstract

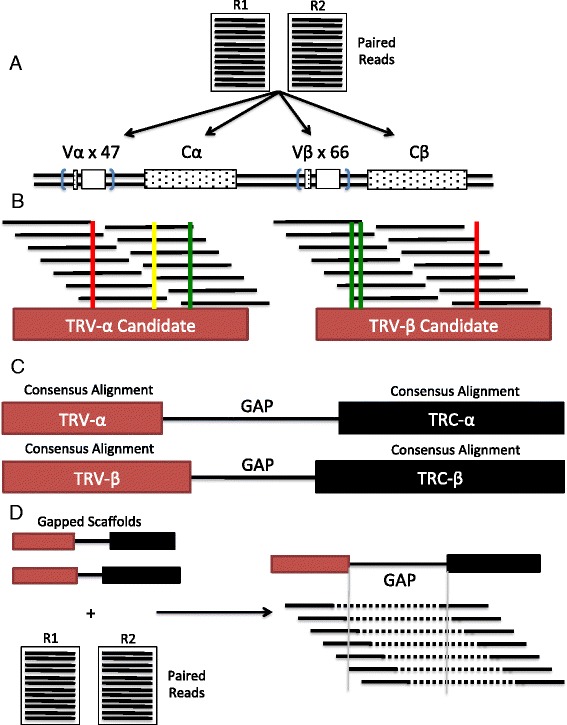
Accurate characterization of the repertoire of the T-cell receptor (TCR) alpha and beta chains is critical to understanding adaptive immunity. Such characterization has many applications across such fields as vaccine development and response, clone-tracking in cancer, and immunotherapy. Here we present a new methodology called single-cell TCRseq (scTCRseq) for the identification and assembly of full-length rearranged V(D)J T-cell receptor sequences from paired-end single-cell RNA sequencing reads. The method allows accurate identification of the V(D)J rearrangements for each individual T-cell and has the novel ability to recover paired alpha and beta segments. Source code is available at https://github.com/ElementoLab/scTCRseq .


Figures

Fig. 1
Fig. 1
Schematic overview of scTCRseq pipeline. a Input fastq files are BLAST-aligned to custom reference TCR alpha and beta variable and constant regions genes. b Consensus-driven multiple alignment to candidate genes is performed to create V and C gene sequence “contigs.” Correct alleles are inferred from the consensus. c Each consensus V region is concatenated to its corresponding C region consensus with a gap to create a scaffold to perform gap-filling. d GapFiller finds read pairs of which one member matches within a sequence region and the second member falls (partially) within the gap to join the scaffolds and recover full alpha or beta chains if successful
Fig. 2
Fig. 2
Expression of TCR alpha and beta chain variable gene transcripts relative to the rest of the transcriptome. a Histogram of the logarithm of the mean unadjusted fragments per kilobase per million mapped reads (FPKMs) over all 91 mice T-cell samples, comprising average FPKMs of 7990 genes. The location of the average logarithm FPKMs of the TRAV and TRBV genes is also outlined. b List of the top 30 mean-expressed genes over all 91 mice T-cell samples comprising average FPKMs of 7990 genes with the location of TRAV and TRBV genes on the list
Fig. 3
Fig. 3
Count-based analysis of TCR alpha and beta chain variable gene transcripts across the filtered 71 mice T-cell samples. a Heatmap of percentage of nucleotide BLAST-mapped TRBV genes mapping to individual TRBV genes (x-axis) across 71 mouse T-cell samples (y-axis). Increasing shades of blue denote increased percentage of all TRBV-mapping reads mapping to a particular TRBV gene. b Heatmap of percentage of nucleotide BLAST-mapped TRAV genes mapping to individual TRAV genes (x-axis) across 71 mouse T-cell samples (y-axis). Increasing shades of red denote increased percentage of all TRAV-mapping reads mapping to a particular TRAV gene. c Log-log plot of total reads that nucleotide BLAST-mapped to TCR variable regions. The x-axis measures the logarithm of the count of total reads mapping to any TRBV gene for a single sample and the y-axis measures the logarithm of the count of total reads mapping to any TRAV gene. Each colored point represents an individual mouse T-cell samples with read points denoting GFP negative T-cells and blue points denoting GFP positive T-cells. The lines at x = 2.3 and y = 1.9 represent cutoffs for which samples were selected for further analysis based upon their expression of TCR transcripts (bottom 10th percentile cutoff). The 59 samples in the upper right quadrant of the figure underwent further targeted assembly. d Heatmap of paired TCR alpha and beta chain expression with x-axis representing chosen TCR beta chain V usage and the y-axis representing TCR alpha chain V usage. Color scale ranged from white for no particular (TRBV, TRAV) usage to dark orange for two samples observing the same (TRBV, TRAV) usage
Fig. 4
Fig. 4
TCR V(D)J sequence usage in Sample ERR488963. a IGV plot of read coverage for entire assembled TCR beta chain sequence. The tracks underneath the reads denote the TCR beta V gene (TRBV14*01 in blue, TRBD2*01 in green, TRBJ2-7*01 in red, and TRBC2 in black). b Schematic of nucleotide insertions and deletions at V(D)J junctions in both alpha and beta chains

References

    1. Han A, Glanville J, Hansmann L, Davis MM. Linking T-cell receptor sequence to functional phenotype at the single-cell level. Nat Biotechnol. 2014;32(7):684–92. doi: 10.1038/nbt.2938. - DOI - PMC - PubMed
    1. Jiang N, Zhang S, Ma K. An ID card for T cells. Nat Biotechnol. 2014;32(7):639–40. doi: 10.1038/nbt.2953. - DOI - PubMed
    1. Dash P, McClaren JL, Oguin TH, 3rd, Rothwell W, Todd B, Morris MY, et al. Paired analysis of TCRα and TCRβ chains at the single-cell level in mice. J Clin Invest. 2011;121(1):288–95. doi: 10.1172/JCI44752. - DOI - PMC - PubMed
    1. DeKosky BJ, Ippolito GC, Deschner RP, Lavinder JJ, Wine Y, Rawlings BM, et al. High-throughput sequencing of the paired human immunoglobulin heavy and light chain repertoire. Nat Biotechnol. 2013;31(2):166–9. doi: 10.1038/nbt.2492. - DOI - PMC - PubMed
    1. Howie B, Sherwood AM, Berkebile AD, Berka J, Emerson RO, Williamson DW, et al. High-throughput pairing of T cell receptor and sequences. Sci Transl Med. 2015;7(301):301ra131–ra301ra131. doi: 10.1126/scitranslmed.aac5624. - DOI - PubMed

Publication types

MeSH terms

Substances

Associated data