. 2017 Jan;42(2):502-511.
doi: 10.1038/npp.2016.133. Epub 2016 Jul 27.

Characterization of Glutamatergic and GABAA-Mediated Neurotransmission in Motor and Dorsolateral Prefrontal Cortex Using Paired-Pulse TMS-EEG

Affiliations

Characterization of Glutamatergic and GABAA-Mediated Neurotransmission in Motor and Dorsolateral Prefrontal Cortex Using Paired-Pulse TMS-EEG

Robin F H Cash et al. Neuropsychopharmacology. 2017 Jan.

Abstract

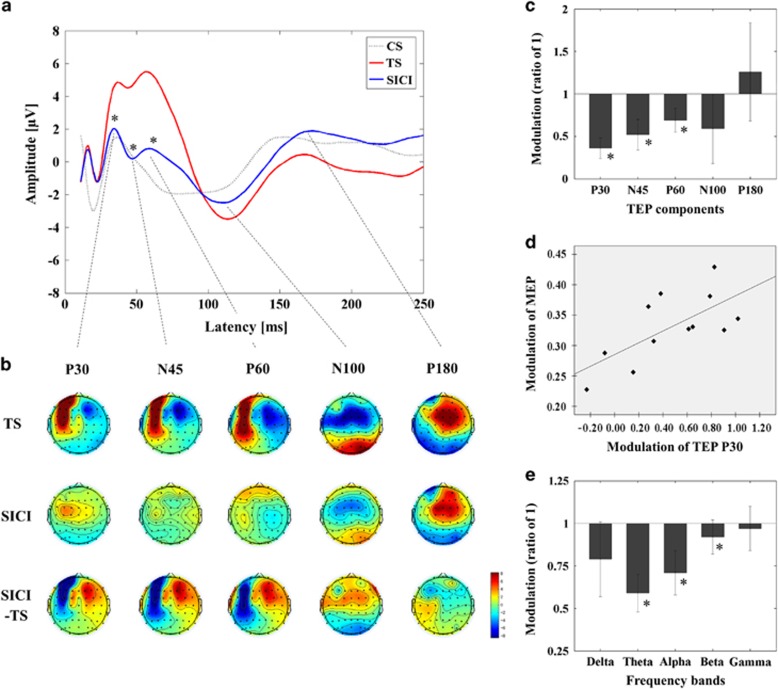
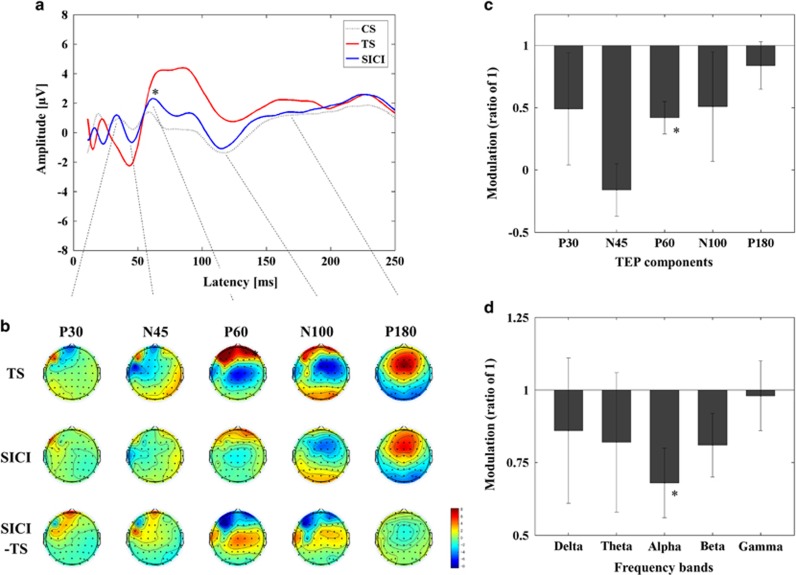
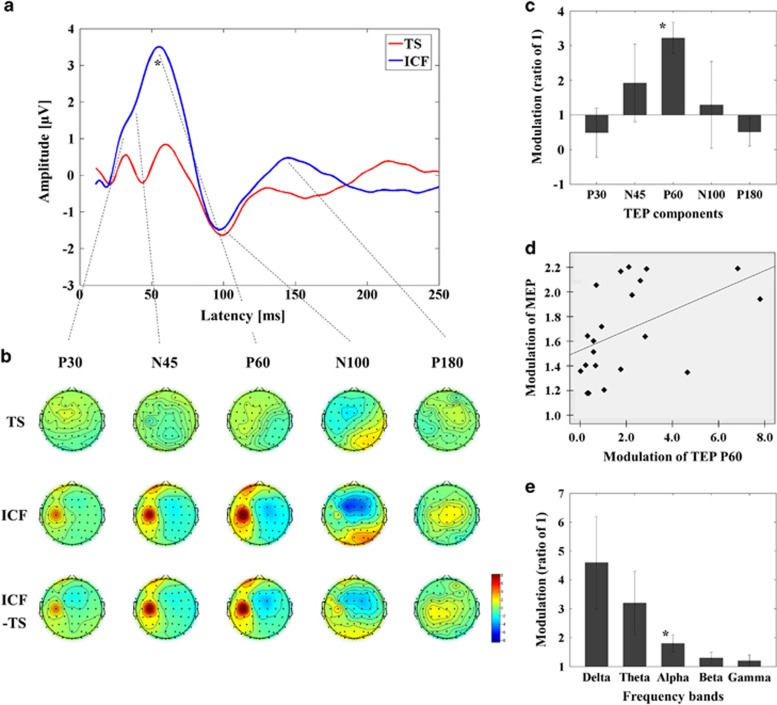
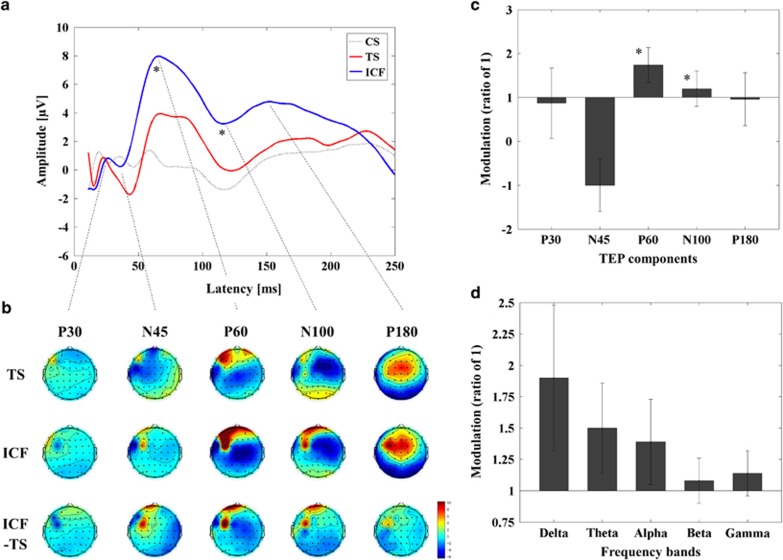
Short-interval intracortical inhibition (SICI) and intracortical facilitation (ICF) are noninvasive transcranial magnetic stimulation (TMS) measures of GABAA receptor-mediated inhibition and glutamatergic excitatory transmission, respectively. Conventionally these measures have been restricted to the motor cortex. We investigated whether SICI and ICF could be recorded from the dorsolateral prefrontal cortex (DLPFC) using combined TMS and electroencephalography (TMS-EEG). We first characterized the neural signature of SICI and ICF in M1 in terms of TMS-evoked potentials (TEPs) and spectral power modulation. Subsequently, these paradigms were applied in the DLPFC to determine whether similar neural signatures were evident. With TMS at M1, SICI and ICF led to bidirectional modulation (inhibition and facilitation, respectively) of P30 and P60 TEP amplitude, which correlated with MEP amplitude changes. With DLPFC stimulation, P60 was bidirectionally modulated by SICI and ICF in the same manner as for M1 stimulation, whereas P30 was absent. The sole modulation of early TEP components is in contradistinction to other measures such as long-interval intracortical inhibition and may reflect modulation of short latency excitatory and inhibitory postsynaptic potentials (EPSPs and IPSPs). Overall, the data suggest that SICI and ICF can be recorded using TMS-EEG in DLPFC providing noninvasive measures of glutamatergic and GABAA receptor-mediated neurotransmission. This may facilitate future research attempting to ascertain the role of these neurotransmitters in the pathophysiology and treatment of neurological and psychiatric disorders.


Figures

Figure 1
Figure 1
Inhibitory influence of SICI on TEPs with TMS over M1. (a) Group averaged TEPs following TS (red; delivered at a time equal to 0 ms), SICI (CS.TS) (blue) and CS alone (dotted line; delivered at –-2 ms, that is, 2 ms prior to TS). P30, N45, and P60 were significantly reduced in amplitude by SICI. (b) Topographical display of the suppression of TEP components by SICI. (c) Amplitude suppression of TEP components by SICI (mean±SEM) is displayed as a ratio of 1 (1 is equivalent to no change relative to the TEP amplitude of TS alone; *P<0.05). Note that TEP latency varied according to individual, TEP and condition leading to phase cancellation in the average trace and voiding direct comparison between (a and c) in all figures. (d) The suppression of MEP amplitude by SICI and of P30 TEP was significantly positively correlated (Pearson's correlation, r=0.678, p=0.015, N=12). (e) Modulation of cortical oscillatory power. M1–SICI was associated with a significant decrease in power in the theta, alpha, and beta bands (*P<0.05). A full color version of this figure is available at the Neuropsychopharmacology journal online.
Figure 2
Figure 2
Inhibitory influence of SICI on TEPs with TMS over DLPFC. (a) Group averaged TEPs following TS (red; delivered at a time equal to 0 ms), SICI (CS.TS) (blue) and CS alone (dotted line; delivered at -2 ms, ie, 2 ms prior to TS). P60 was significantly reduced in amplitude by SICI, whereas P30 was not apparent in DLPFC. (b) Topographical display of the suppression of TEP components by SICI. (c) Amplitude suppression of TEP components by SICI (mean±SEM) is quantified as a ratio of 1 (1 is equivalent to no change relative to the TEP amplitude of TS alone; *P<0.05). The modulation of TEP components by SICI (mean±SEM) is displayed as a ratio of 1 (1 is equivalent to no change; *P<0.05). (d) Modulation of cortical oscillatory power. DLPFC–SICI was associated with a significant decrease in power specific to the alpha band (*P<0.05). A full color version of this figure is available at the Neuropsychopharmacology journal online.
Figure 3
Figure 3
Facilitatory influence of ICF on TEPs with TMS over M1, recorded in a separate group of 21 individuals. (a) Group averaged TEPs following TS (red; delivered at a time equal to 0 ms) and ICF (CS.TS) (blue). P60 was significantly increased in amplitude by ICF. P30 appeared to be increased in amplitude but was not evident as a distinct peak. (b) Topographical display of the facilitation of TEP components by ICF. (c) The modulation of TEP components by ICF (mean±SEM) is displayed as a ratio of 1 (1 is equivalent to no change relative to the TEP amplitude of TS alone; *P<0.05). (d) The facilitation of the MEP amplitude by ICF and of P60 TEP was significantly positively correlated (Pearson's correlation, r=0.543, p=0.011, N=21). (e) Modulation of cortical oscillatory power. M1–ICF was associated with a significant increase in power in the alpha band (*P<0.05). A full color version of this figure is available at the Neuropsychopharmacology journal online.
Figure 4
Figure 4
Facilitatory influence of ICF on TEPs with TMS over DLPFC. (a) Group averaged TEPs following TS (red; delivered at a time equal to 0 ms), ICF (CS.TS) (blue) and CS alone (dotted line; delivered at -10 ms, ie, 10 ms prior to TS). P60 was significantly increased in amplitude similar to M1–ICF, whereas P30 was not evident in DLPFC. In addition, there was a longer lasting increase in EEG-positive potential with a modulation of N100 amplitude. (b) The topographical distribution of TEP components, and their modulation by ICF, is displayed. Note that the topographical distributions of TEPs from TS for DLPFC–ICF and DLPFC–SICI are equivalent, but that the scaling has been adjusted in each case to better visualize the respective changes. (c) The modulation of TEP components by ICF (mean±SEM) is displayed as a ratio of 1 (1 is equivalent to no change relative to the TEP amplitude of TS alone; *P<0.05). Note that DLPFC–ICF increases the positivity of N45 (consistent with M1–ICF), but that this is equivalent to a decrease the amplitude of N45 in DLPFC–ICF, resulting in a negative ratio. (d) DLPFC–ICF did not modulate power in any frequency band. A full color version of this figure is available at the Neuropsychopharmacology journal online.

References

    1. Bartos M, Vida I, Jonas P (2007). Synaptic mechanisms of synchronized gamma oscillations in inhibitory interneuron networks. Nat Rev Neurosci 8: 45–56. - PubMed
    1. Berchou R, Chayasirisobhon S, Green V, Mason K (1986). The pharmacodynamic properties of lorazepam and methylphenidate drugs on event-related potentials and power spectral analysis in normal subjects. Clin Electroencephalogr 17: 176–180. - PubMed
    1. Chen R, Curra A (2004). Measures of cortical inhibition in health and disease. Suppl Clin Neurophysiol 57: 691–701. - PubMed
    1. Claus D, Weis M, Jahnke U, Plewe A, Brunholzl C (1992). Corticospinal conduction studied with magnetic double stimulation in the intact human. J Neurol Sci 111: 180–188. - PubMed
    1. Coxon JP, Stinear CM, Byblow WD (2006). Intracortical inhibition during volitional inhibition of prepared action. J Neurophysiol 95: 3371–3383. - PubMed

Publication types

Grants and funding