. 2017 Aug 1;27(8):4033-4047.
doi: 10.1093/cercor/bhw215.

Rostro-caudal Architecture of the Frontal Lobes in Humans

Affiliations

Rostro-caudal Architecture of the Frontal Lobes in Humans

Michel Thiebaut de Schotten et al. Cereb Cortex. .

Abstract

The nature of the inputs and outputs of a brain region defines its functional specialization. The frontal portion of the brain is essential for goal-directed behaviors, however, the biological basis for its functional organization is unknown. Here, exploring structural connectomic properties, we delineated 12 frontal areas, defined by the pattern of their white matter connections. This result was highly reproducible across neuroimaging centers, acquisition parameters, and participants. These areas corresponded to regions functionally engaged in specific tasks, organized along a rostro-caudal axis from the most complex high-order association areas to the simplest idiotopic areas. The rostro-caudal axis along which the 12 regions were organized also reflected a gradient of cortical thickness, myelination, and cell body density. Importantly, across the identified regions, this gradient of microstructural features was strongly associated with the varying degree of information processing complexity. These new anatomical signatures shed light onto the structural organization of the frontal lobes and could help strengthen the prediction or diagnosis of neurodevelopmental and neurodegenerative disorders.

Keywords: anatomy; cytoarchitecture; frontal lobes; myeloarchitecture; tractography.


Figures

Figure 1.
Figure 1.
Tractography-based subdivision. (a) Left, example of a seed ROI used for tractography. Middle, example of a target ROI used for tractography. Right, example of the probabilistic tractography from the seed to the target. (b) Graph of the principal components (x) according to their eigenvalue sizes (y) for all subjects. Different colors are used for each subject. (c) Graph of the principal components (x) according to their eigenvalue sizes (y) for one representative subject. Original data is represented in purple and fitted data in cyan.
Figure 2.
Figure 2.
Brain regions of the frontal lobes defined using anatomical connectivity. (a) Lateral and medial views. (b) Montreal Neurological Institute stereotaxic coronal sections.
Figure 3.
Figure 3.
Z-score of the distribution of the structural connections emerging from each CBR. Ant, anterior; Mid, middle; Post, posterior; Cing., cingulate; ParaHippo., parahippocampic gyrus; Hippo, hippocampic gyrus; Sup, superior; Inf, inferior; Supramarg, supramarginal gyrus; Temp, temporal; Mid Po, middle posterior; Occ, occipital.
Figure 4.
Figure 4.
Reproducibility across datasets (a) Human Connectome Project and (b) local dataset tractography-based subdivision of the whole frontal lobe; (c–e) 3 representative participants (respectively c, best case; d, average case; and e, worst case).
Figure 5.
Figure 5.
Function most likely activated for each CBR. (a) Z-score indicate the likeliness for each CBR to be activated for the term indicated in ordinate (compared with 2912 other term-related activations provided in Neurosynth, http://www.neurosynth.org). (b) Spatial correlations between each CBR and functional maps (illustrated in Figure 5). “foot”: lower limb primary motor area, “motor”: upper limb motor area, “eye field”: frontal eye field, “language production”: broca's area, “pre-SMA”: pre-supplementary motor area, “phonological:” phonological processing, “semantic”: semantic knowledge, “social”: social functions, “value”: value-based behavior.
Figure 6.
Figure 6.
Side-by-side comparison between the CBR1-6s’ percentage maps and task-related fMRI maps drawn from meta analyzes in Neurosynth (http://www.neurosynth.org).
Figure 7.
Figure 7.
Side-by-side comparison between the CBR7-12s’ percentage maps and task-related fMRI maps drawn from meta analyzes in Neurosynth (http://www.neurosynth.org).
Figure 8.
Figure 8.
Correlations between the posterior–anterior position of each region's centroid and cortical thickness (a) at the group level (b) at the individual level in three participants. LH, left hemisphere; RH, right hemisphere; MNI, Montreal Neurological Institute (http://www.bic.mni.mcgill.ca). *P < 0.05, **P < 0.01, ***P < 0.001.
Figure 9.
Figure 9.
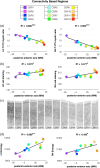
Correlations between the postero-anterior position of each CBR and (a) T1w/T2w myelin ratio. (b) Silver staining of cortical cell bodies (decreased values indicate an increase in the staining of tissue). (c) An example of cortical cell bodies staining for each CBR (http://bigbrain.loris.ca) (d) Correlations between the postero-anterior position of each CBR and functional magnetic resonance imaging entropy. LH, left hemisphere; RH, right hemisphere. *P < 0.05, **P < 0.01, ***P < 0.001.

References

    1. Aganj I, Lenglet C, Sapiro G, Yacoub E, Ugurbil K, Harel N.. 2010. Reconstruction of the orientation distribution function in single- and multiple-shell q-ball imaging within constant solid angle. Magn Reson Med. 64:554–566. - PMC - PubMed
    1. Aichelburg C, Urbanski M, Thiebaut de Schotten M, Humbert F, Levy R, Volle E.. 2016. Morphometry of left frontal and temporal poles predicts analogical reasoning abilities. Cereb Cortex. 26:915–932. - PubMed
    1. Amunts K, Lepage C, Borgeat L, Mohlberg H, Dickscheid T, Rousseau ME, Bludau S, Bazin PL, Lewis LB, Oros-Peusquens AM, et al. .. 2013. BigBrain: an ultrahigh-resolution 3D human brain model. Science. 340:1472–1475. - PubMed
    1. Anderson JLR, Jenkinson M, Smith S.. 2007. Non-linear registration aka Spatial normalisation. FMRIB Technial Report TR07JA2.
    1. Andersson JL, Skare S, Ashburner J.. 2003. How to correct susceptibility distortions in spin-echo echo-planar images: application to diffusion tensor imaging. Neuroimage. 20:870–888. - PubMed

Publication types

MeSH terms