. 2017 May 1;18(8):888-897.
doi: 10.1093/ehjci/jew134.

Association of global and local low endothelial shear stress with high-risk plaque using intracoronary 3D optical coherence tomography: Introduction of 'shear stress score'

Affiliations

Association of global and local low endothelial shear stress with high-risk plaque using intracoronary 3D optical coherence tomography: Introduction of 'shear stress score'

Yiannis S Chatzizisis et al. Eur Heart J Cardiovasc Imaging. .

Abstract

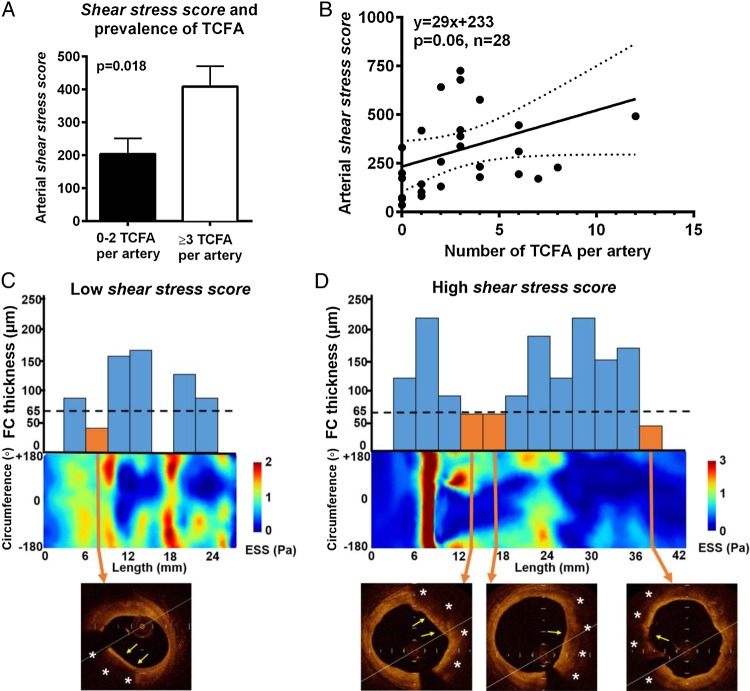
Aims: The association of low endothelial shear stress (ESS) with high-risk plaque (HRP) has not been thoroughly investigated in humans. We investigated the local ESS and lumen remodelling patterns in HRPs using optical coherence tomography (OCT), developed the shear stress score, and explored its association with the prevalence of HRPs and clinical outcomes.

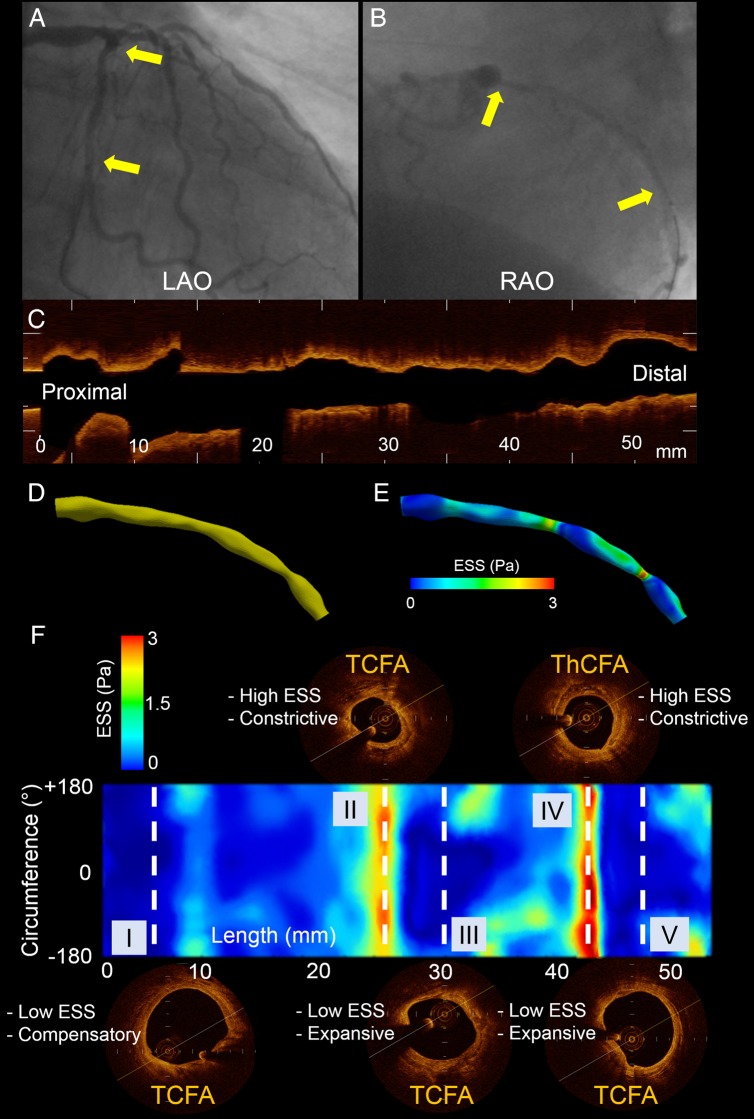
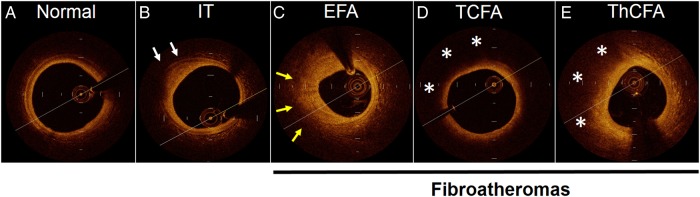
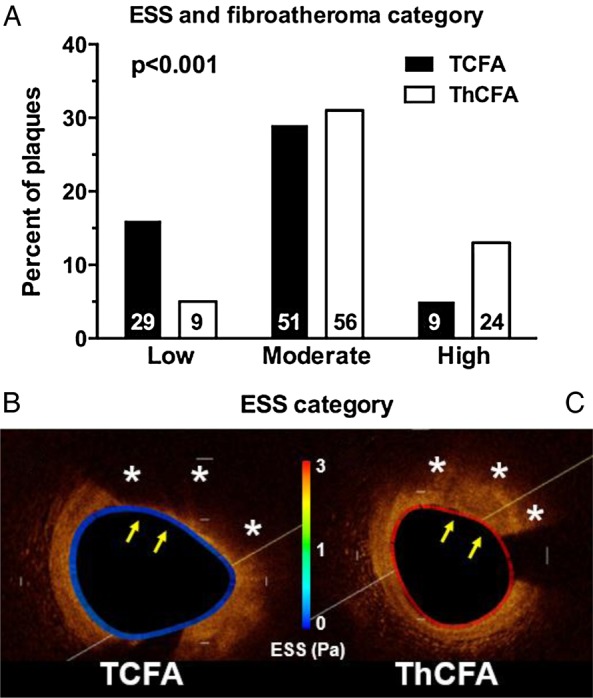
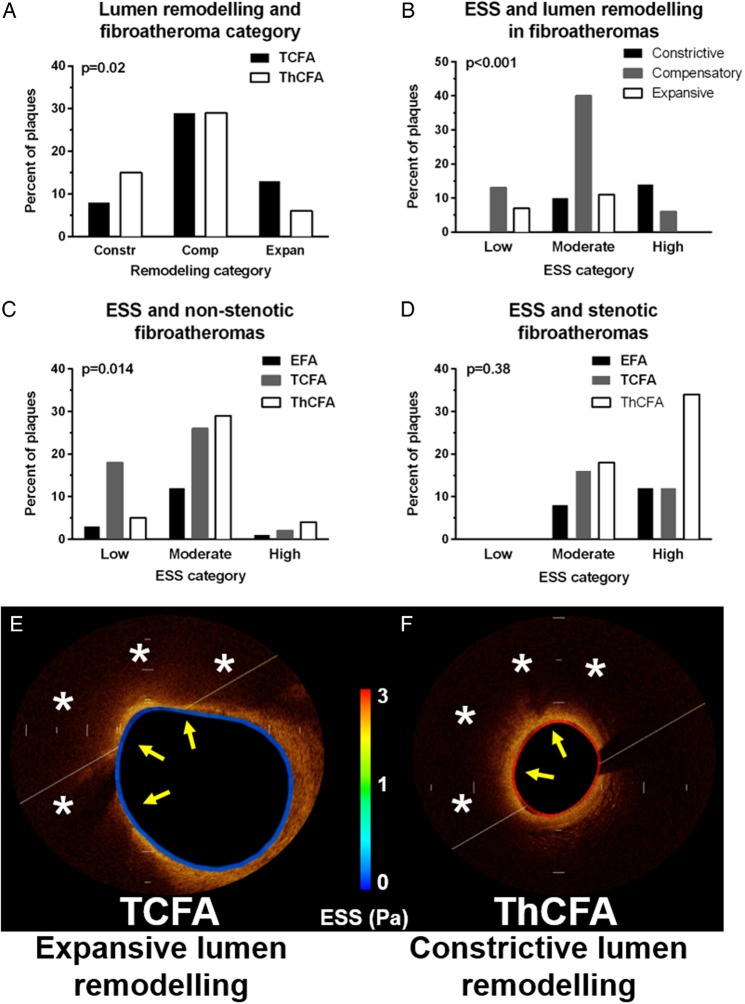
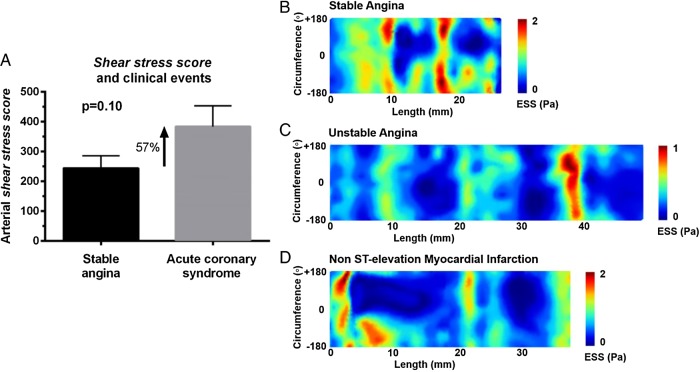
Methods and results: A total of 35 coronary arteries from 30 patients with stable angina or acute coronary syndrome (ACS) were reconstructed with three dimensional (3D) OCT. ESS was calculated using computational fluid dynamics and classified into low, moderate, and high in 3-mm-long subsegments. In each subsegment, (i) fibroatheromas (FAs) were classified into HRPs and non-HRPs based on fibrous cap (FC) thickness and lipid pool size, and (ii) lumen remodelling was classified into constrictive, compensatory, and expansive. In each artery the shear stress score was calculated as metric of the extent and severity of low ESS. FAs in low ESS subsegments had thinner FC compared with high ESS (89 ± 84 vs.138 ± 83 µm, P < 0.05). Low ESS subsegments predominantly co-localized with HRPs vs. non-HRPs (29 vs. 9%, P < 0.05) and high ESS subsegments predominantly with non-HRPs (9 vs. 24%, P < 0.05). Compensatory and expansive lumen remodelling were the predominant responses within subsegments with low ESS and HRPs. In non-stenotic FAs, low ESS was associated with HRPs vs. non-HRPs (29 vs. 3%, P < 0.05). Arteries with increased shear stress score had increased frequency of HRPs and were associated with ACS vs. stable angina.

Conclusion: Local low ESS and expansive lumen remodelling are associated with HRP. Arteries with increased shear stress score have increased frequency of HRPs and propensity to present with ACS.

Keywords: clinical events; coronary artery disease; endothelial shear stress; high-risk plaque; optical coherence tomography; shear stress score; vascular remodelling.


Figures

Figure 1
Figure 1
Representative 3D reconstructed left circumflex artery segment. (A) Left anterior oblique (LAO) angiographic plane. (B) Right anterior oblique (RAO) angiographic plane; yellow arrows denote the start and end of the reconstructed segment. (C) OCT run in longitudinal view. (D) 3D reconstructed segment based on the fusion of two angiographic planes and OCT. (E) ESS distribution in the 3D reconstructed segment. (F) 2D map of ESS along the reconstructed segment with y-axis corresponding to the vessel circumference and x-axis to the vessel length. Note the plaque type, ESS and lumen remodelling heterogeneity along the same segment. Dashed lines correspond to the middle of 3-mm-long subsegments of interest. In subsegments I, III, and V, there is colocalization of low ESS, expansive/compensatory lumen remodelling, and TCFA (III and V are mixed plaques with thin FC). Subsegment II contains a TCFA (mixed plaque with thin FC) in high ESS environment with constrictive lumen remodelling. Subsegment IV contains a ThCFA (mixed plaque with thick FC) in high ESS environment with associated constrictive lumen remodelling.
Figure 2
Figure 2
Plaque classification by OCT based on consensus documents.,, IT, intimal thickening (white arrows denote well-defined external elastic membrane). EFA, early fibroatheroma (yellow arrows denote poor-defined external elastic membrane). TCFA, thin cap fibroatheroma (asterisks denote lipid core). ThCFA, thick cap fibroatheroma (asterisks denote lipid core).
Figure 3
Figure 3
ESS and FA category. (A) The prevalence of TCFA was significantly increased in low ESS subsegments, whereas the prevalence of ThCFA was significantly increased in high ESS subsegments. Numbers within the bars represent absolute numbers. Comparisons between low and moderate ESS and between low and high ESS were statistically significant, whereas comparison between moderate and high ESS was statistically non-significant. (B and C) Representative examples of a TCFA in a low ESS environment (B) and a ThCFA in a high ESS environment (C). ESS is colour-coded along the vessel circumference. Asterisks denote lipid core and arrows the FC.
Figure 4
Figure 4
Lumen remodelling, ESS, and FA category. (A) Association of lumen remodelling with FA category. (B) Association of ESS with lumen remodelling in FAs (i.e. EFA, TCFA, and ThCFA). (C) Association of ESS with non-stenotic FAs. (D) Association of ESS with stenotic FAs. (E and F) Representative OCT cross-sections showing co-localization of low ESS (colour-coded along the vessel circumference), expansive lumen remodelling and TCFA plaque morphology (E) and co-localization of high ESS, constrictive lumen remodelling and ThCFA plaque morphology (F). Asterisks denote lipid core and yellow arrows the FC.
Figure 5
Figure 5
Shear stress score and prevalence of TCFA per artery. (A) The prevalence of three or more TCFA per artery was significantly increased in arteries with high shear stress scores. (B) Linear regression analysis showing a positive association between shear stress score and the number of TCFA per artery. (C and D) Representative 2D ESS maps of a low shear stress score artery with 1 TCFA (C) vs. high shear stress score artery with 3 TCFA (plaque on the right side is mixed) (D). Bar graphs show the variation of FC thickness across the length of the artery. Dashed lines correspond to 65 mm which was used as the threshold for thin FC by OCT. Orange bars correspond to TCFA and blue bars to ThCFA/EFA, and no bars denote normal areas or intimal thickening. Asterisks denote lipid core and yellow arrows the FC.
Figure 6
Figure 6
Shear stress score and clinical events. (A) The shear stress score was approximately 60% higher in culprit arteries for acute coronary events vs. stable angina at the time of presentation (trend towards significance). (B–D) Representative 2D ESS maps of a low shear stress score artery culprit for stable angina (B) vs. higher shear stress score artery culprit for unstable angina (C) or non-ST elevation myocardial infarction (D). Note the extensive areas of very low (deep blue) ESS in arteries from patients with ACS vs. stable angina.

Similar articles

Cited by

References

    1. Kwak BR, Back M, Bochaton-Piallat ML, Caligiuri G, Daemen MJ, Davies PF et al. . Biomechanical factors in atherosclerosis: mechanisms and clinical implications. Eur Heart J 2014;35:3013–20, 20a–20d. - PMC - PubMed
    1. Chatzizisis YS, Coskun AU, Jonas M, Edelman ER, Feldman CL, Stone PH. Role of endothelial shear stress in the natural history of coronary atherosclerosis and vascular remodeling: molecular, cellular, and vascular behavior. J Am Coll Cardiol 2007;49:2379–93. - PubMed
    1. Wentzel JJ, Chatzizisis YS, Gijsen FJ, Giannoglou GD, Feldman CL, Stone PH. Endothelial shear stress in the evolution of coronary atherosclerotic plaque and vascular remodelling: current understanding and remaining questions. Cardiovasc Res 2012;96:234–43. - PubMed
    1. Chatzizisis YS, Jonas M, Coskun AU, Beigel R, Stone BV, Maynard C et al. . Prediction of the localization of high-risk coronary atherosclerotic plaques on the basis of low endothelial shear stress: an intravascular ultrasound and histopathology natural history study. Circulation 2008;117:993–1002. - PubMed
    1. Chatzizisis YS, Baker AB, Sukhova GK, Koskinas KC, Papafaklis MI, Beigel R et al. . Augmented expression and activity of extracellular matrix-degrading enzymes in regions of low endothelial shear stress colocalize with coronary atheromata with thin fibrous caps in pigs. Circulation 2011;123:621–30. - PMC - PubMed

MeSH terms