. 2017 Jan 1;595(1):165-178.
doi: 10.1113/JP272292. Epub 2016 Sep 15.

Endocannabinoids control vesicle release mode at midbrain periaqueductal grey inhibitory synapses

Affiliations

Endocannabinoids control vesicle release mode at midbrain periaqueductal grey inhibitory synapses

Karin R Aubrey et al. J Physiol. .

Abstract

Key points: The midbrain periaqueductal grey (PAG) forms part of an endogenous analgesic system which is tightly regulated by the neurotransmitter GABA. The role of endocannabinoids in regulating GABAergic control of this system was examined in rat PAG slices. Under basal conditions GABAergic neurotransmission onto PAG output neurons was multivesicular. Activation of the endocannabinoid system reduced GABAergic inhibition by reducing the probability of release and by shifting release to a univesicular mode. Blockade of endocannabinoid system unmasked a tonic control over the probability and mode of GABA release. These findings provides a mechanistic foundation for the control of the PAG analgesic system by disinhibition.

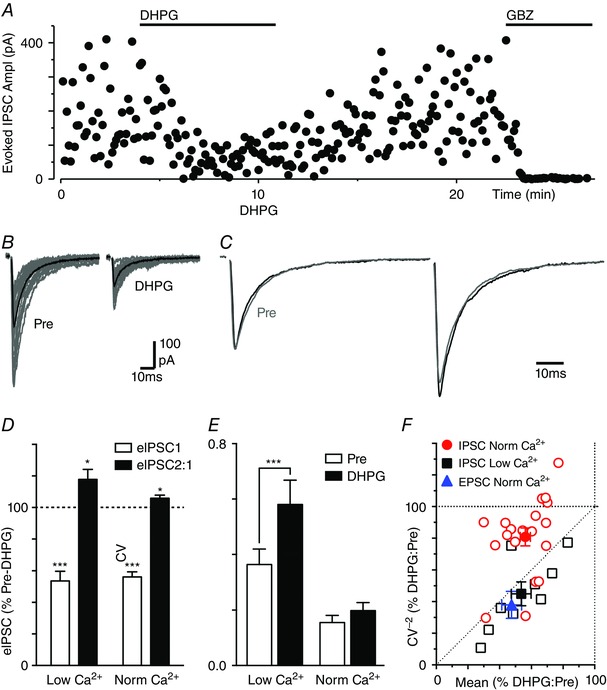
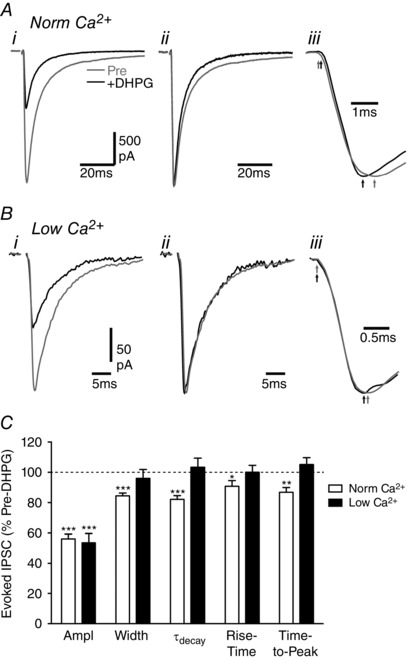
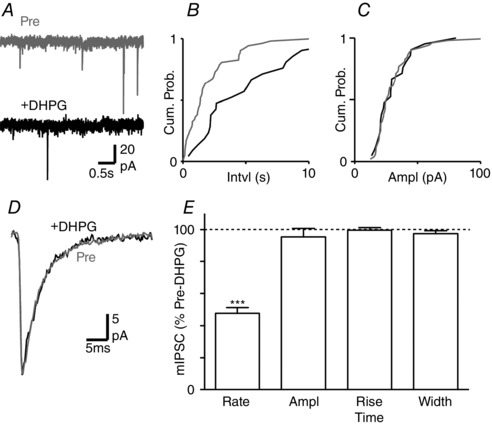
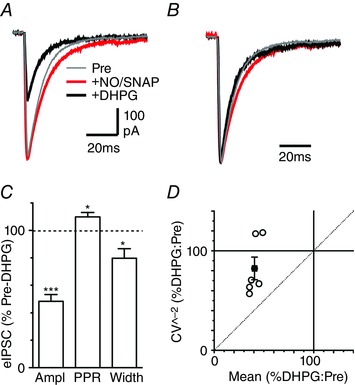
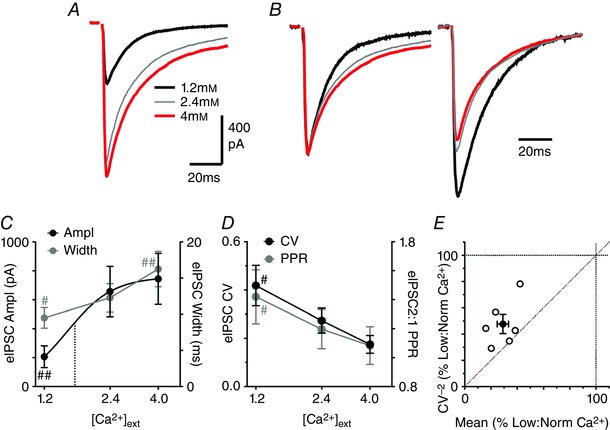
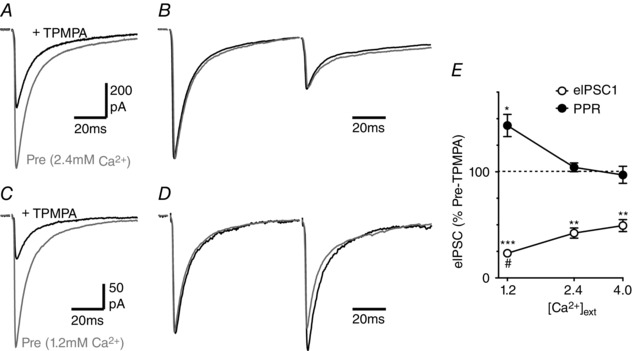
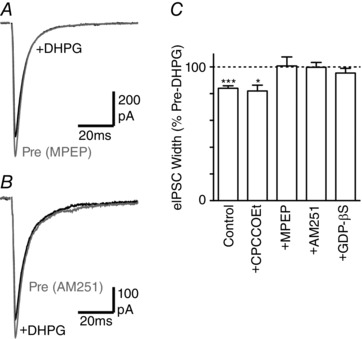
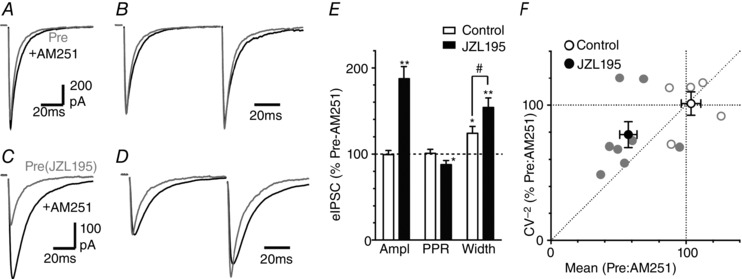
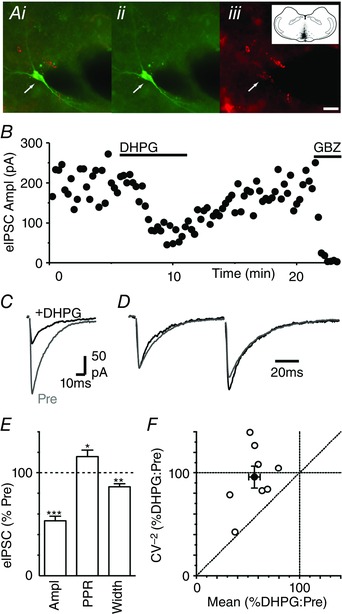
Abstract: The midbrain periaqueductal grey (PAG) has a crucial role in coordinating endogenous analgesic responses to physiological and psychological stressors. Endocannabinoids are thought to mediate a form of stress-induced analgesia within the PAG by relieving GABAergic inhibition of output neurons, a process known as disinhibition. This disinhibition is thought to be achieved by a presynaptic reduction in GABA release probability. We examined whether other mechanisms have a role in endocannabinoid modulation of GABAergic synaptic transmission within the rat PAG. The group I mGluR agonist DHPG ((R,S)-3,5-dihydroxyphenylglycine) inhibited evoked IPSCs and increased their paired pulse ratio in normal external Ca2+ , and when release probability was reduced by lowering Ca2+ . However, the effect of DHPG on the coefficient of variation and kinetics of evoked IPSCs differed between normal and low Ca2+ . Lowering external Ca2+ had a similar effect on evoked IPSCs to that observed for DHPG in normal external Ca2+ . The low affinity GABAA receptor antagonist TPMPA ((1,2,5,6-tetrahydropyridin-4-yl)methylphosphinic acid) inhibited evoked IPSCs to a greater extent in low than in normal Ca2+ . Together these findings indicate that the normal mode of GABA release is multivesicular within the PAG, and that DHPG and lowering external Ca2+ switch this to a univesicular mode. The effects of DHPG were mediated by mGlu5 receptor engagement of the retrograde endocannabinoid system. Blockade of endocannabinoid breakdown produced a similar shift in the mode of release. We conclude that endocannabinoids control both the mode and the probability of GABA release within the PAG.

Keywords: endocannabinoid; gaba; multivesicular; pain; synaptic transmission.


Figures

Figure 1
Figure 1. DHPG inhibits evoked IPSCs by different mechanisms in normal and reduced external Ca2+
A, time plot of the amplitude of evoked IPSCs during superfusion of DHPG (10 μm) and gabazine (GBZ, 10 μm). B, traces of evoked IPSCs before (Pre) and during DHPG superfusion (15 raw IPSCs in grey and average trace in black). C, averaged traces of paired evoked IPSCs before (Pre) and during DHPG with the first IPSC normalized. D, bar chart of the effect of DHPG on evoked IPSC amplitude and paired pulse ratio (eIPSC2:1) in normal and low external Ca2+, shown as a percentage of the pre‐DHPG value. E, bar chart of the coefficient of variation (CV) of evoked IPSC amplitude before (Pre) and during DHPG superfusion, in normal and low external Ca2+. In D and E, asterisks denote * P < 0.05, ***0.0001 for DHPG versus pre‐DHPG. F, plot of the effect of DHPG on the CV−2 versus mean of evoked IPSCs in normal (red) and low external Ca2+ (black), and also for evoked EPSCs in normal Ca2+ (blue). In F, data are shown for individual neurons (open symbols) and the average for all neurons tested under each condition (filled symbols). [Colour figure can be viewed at wileyonlinelibrary.com]
Figure 2
Figure 2. DHPG shortens the decay phase of evoked IPSCs in normal but not low external Ca2+
A and B, averaged traces of evoked IPSCs in (A) normal and (B) low external Ca2+ in two PAG neurons before (Pre) and during superfusion of DHPG (10 μm). Traces are shown for (i) raw averaged evoked IPSCs, (ii) normalized evoked IPSCs and (iii) normalized evoked IPSCs on an expanded time scale showing the onset and time of the IPSC peak (arrows in A). C, bar chart of the effect of DHPG on evoked IPSC amplitude, width, weighted decay phase time constant (τdecay), rise time and the time to peak, shown as a percentage of the pre‐DHPG value. Asterisks denote * P < 0.05, **0.01 and ***0.0001 for DHPG versus pre‐DHPG.
Figure 3
Figure 3. DHPG has no effect on miniature IPSC kinetics
A, raw traces of miniature IPSCs in a PAG neuron, before (Pre) and during superfusion of DHPG (10 μm). B and C, cumulative distribution plots of miniature IPSC (B) inter‐event interval and (C) amplitude, before (Pre) and during DHPG. D, averaged traces of miniature IPSCs, before (Pre) and during DHPG. E, bar chart of the effect of DHPG on miniature IPSC rate, amplitude, rise time and width, shown as a percentage of the pre‐DHPG value. *** P < 0.0001 for DHPG versus pre‐DHPG.
Figure 4
Figure 4. GAT blockade does not alter the effect of DHPG on evoked IPSC kinetics and CV
A, average traces of evoked IPSCs in a PAG neuron in the presence of the GABAB antagonist CGP55845 (1 μm), before (Pre) then after addition of NO711 (10 μm) plus SNAP5114 (40 μm) (NO/SNAP), then after further addition of DHPG (10 μm). B, normalized traces of averaged evoked EPSCs from A. C, bar chart of the effect of DHPG on the evoked IPSC amplitude (Ampl), paired pulse ratio and width, in the presence of CGP55845, NO711 and SNAP5114, shown as a percentage of the pre‐DHPG value. * P < 0.05 and ***0.0001 for DHPG versus pre‐DHPG. D, plot of the effect of DHPG on the CV−2 versus mean of evoked IPSCs in the presence of CGP55845 and GAT blockers; data are shown for individual neurons (open circles) and the average of neurons tested (filled circles). [Colour figure can be viewed at wileyonlinelibrary.com]
Figure 5
Figure 5. Altering external Ca2+ modulates evoked IPSC CV and width
A, averaged traces of evoked IPSCs in a PAG neuron, in normal (2.4 mm), low (1.2 mm) and then high (4.0 mm) external Ca2+. B, averaged traces of paired evoked EPSCs for the neuron in A, normalized for the first evoked IPSC (inter‐event stimulus 100 ms). C, concentration response curve of the effect of external Ca2+ on evoked IPSC amplitude (Ampl) and width. The data for evoked IPSC amplitude were fit by a logistic function, with the EC50 (1.7 mm) shown by the dotted line. D, concentration response curve of the effect of external Ca2+ on the paired pulse ratio (PPR) and coefficient of variation (CV) of evoked IPSCs. In C and D, has marks denote # P < 0.05 and ##0.01 versus the value in 2.4 mm Ca2+. E, plot of the effect of low external Ca2+ on the CV−2 versus mean of evoked IPSCs, expressed as a percentage of the value in normal external Ca2+. Data are shown for individual neurons (open symbols) and the average for all neurons tested (filled symbols). [Colour figure can be viewed at wileyonlinelibrary.com]
Figure 6
Figure 6. Reducing external Ca2+ affects TPMPA sensitivity
A and C, averaged traces of evoked IPSCs in a PAG neuron in (A) normal (2.4 mm) and (C) low (1.2 mm) external Ca2+, before (Pre) and after application of TPMPA (200 μm). B and D, averaged traces of paired evoked IPSCs for the neuron depicted in A and C, respectively, with the first IPSC normalized. E, bar chart of the effect of TPMPA on the evoked IPSC amplitude (eIPSC1) and paired pulse ratio (PPR) in normal (2.4 mm), low (1.2 mm) and high (4.0 mm) external Ca2+; data shown as a percentage of the pre‐TPMPA value. Asterisks denote * P < 0.05, **0.01 and ***0.0001 for TPMPA versus pre‐TPMPA; # P < 0.05 versus the values in 2.4 mm Ca2+.
Figure 7
Figure 7. The DHPG‐induced reduction in evoked IPSC width is endocannabinoid mediated
A and B, averaged traces of evoked IPSCs in PAG neurons before (Pre) and during superfusion of DHPG (10 μm), in slices pre‐incubated in (A) MPEP (10 μm) and (B) AM251 (1 μm). C, bar chart of the effect of DHPG on evoked IPSC width in untreated slices (control) and in slices pre‐incubated in CPCCOEt (100 μm), MPEP (10 μm) or AM251 (1 μm), or in neurons in which internal GTP was replaced with GDP‐βS. * P < 0.05, ***0.0001 for DHPG versus pre‐DHPG.
Figure 8
Figure 8. Basal endocannabinoid modulation of evoked IPSC kinetics
A and C, averaged traces of evoked IPSCs before and after addition of AM251 (1 μm), in (A) untreated control slices and (C) in slices pre‐incubated in JZL195 (1 μm). B and D, averaged traces of paired evoked IPSCs for the neuron depicted in A and C, respectively, with the first IPSC normalized. E, bar chart of the effect of AM251 on evoked IPSC amplitude, paired pulse ratio (PPR) and width, shown as a percentage of the pre‐AM251 value, in untreated control slices and slices pre‐incubated in JZL195; * P < 0.05 and **0.01 for AM251 versus pre‐ AM251; # P < 0.05 for control versus JZL194 treatment. F, plot of the effect of AM251 on the CV−2 versus mean of evoked IPSCs, expressed as a percentage of the value in normal external Ca2+.
Figure 9
Figure 9. DHPG shortens the evoked IPSCs decay phase in PAG descending projection neurons
A, photomicrographs showing (i) merged and (ii, iii) individual images of biocytin and fluorescent microsphere labelling in a PAG neuron, following RVM injection (inset shows RVM injection site in black). Scale bar = 20 μm. B, time plots of evoked IPSC amplitude during superfusion of DHPG (10 μm) and gabazine (10 μm). C and D, averaged (C) raw and (D) normalized traces of evoked IPSCs in the same PAG neuron before (Pre) and during DHPG. A–D are from the same neuron. E, bar chart of the effect of DHPG on evoked IPSC amplitude, paired pulse ratio (PPR) and width, shown as a percentage of the pre‐DHPG value. * P < 0.05, **0.01, ***0.0001 for DHPG versus pre‐DHPG. F, plot of the effect of DHPG on the CV−2 versus mean of evoked IPSCs, expressed as a percentage of the pre‐DHPG value. Data are shown for individual neurons (open symbols) and the average for all neurons tested (filled symbols). [Colour figure can be viewed at wileyonlinelibrary.com]

References

    1. Anderson WB, Gould MJ, Torres RD, Mitchell VA & Vaughan CW (2014). Actions of the dual FAAH/MAGL inhibitor JZL195 in a murine inflammatory pain model. Neuropharmacology 81, 224–230. - PubMed
    1. Bagley EE, Hacker J, Chefer VI, Mallet C, McNally GP, Chieng BC, Perroud J, Shippenberg TS & Christie MJ (2011). Drug‐induced GABA transporter currents enhance GABA release to induce opioid withdrawal behaviours. Nat Neurosci 14, 1548–1554. - PubMed
    1. Balakrishnan V, Kuo SP, Roberts PD & Trussell LO (2009). Slow glycinergic transmission mediated by transmitter pooling. Nat Neurosci 12, 286–294. - PMC - PubMed
    1. Bender VA, Pugh JR & Jahr CE (2009). Presynaptically expressed long‐term potentiation increases multivesicular release at parallel fibre synapses. J Neurosci 29, 10974–10978. - PMC - PubMed
    1. Biro AA, Holderith NB & Nusser Z (2006). Release probability‐dependent scaling of the postsynaptic responses at single hippocampal GABAergic synapses. J Neurosci 26, 12487–12496. - PMC - PubMed

MeSH terms

LinkOut - more resources