

Enrichment of risk SNPs in regulatory regions implicate diverse tissues in Parkinson's disease etiology
- PMID: 27461410
- PMCID: PMC4962314
- DOI: 10.1038/srep30509
Enrichment of risk SNPs in regulatory regions implicate diverse tissues in Parkinson's disease etiology
Abstract
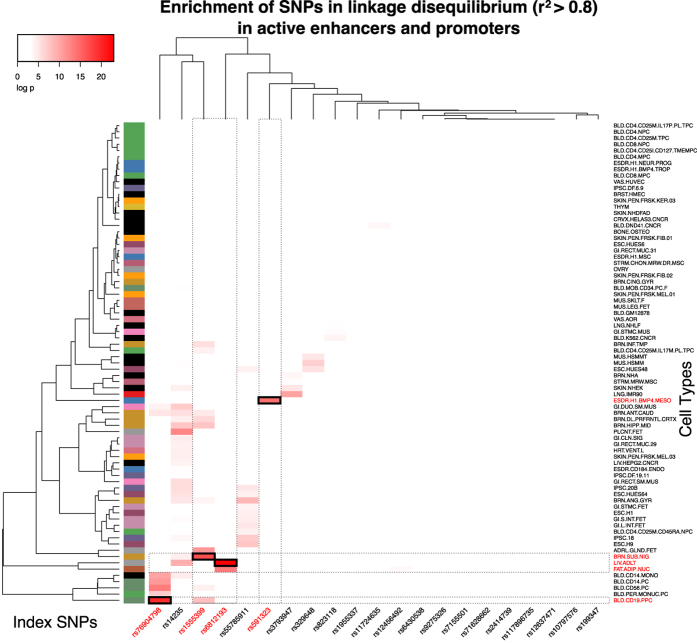
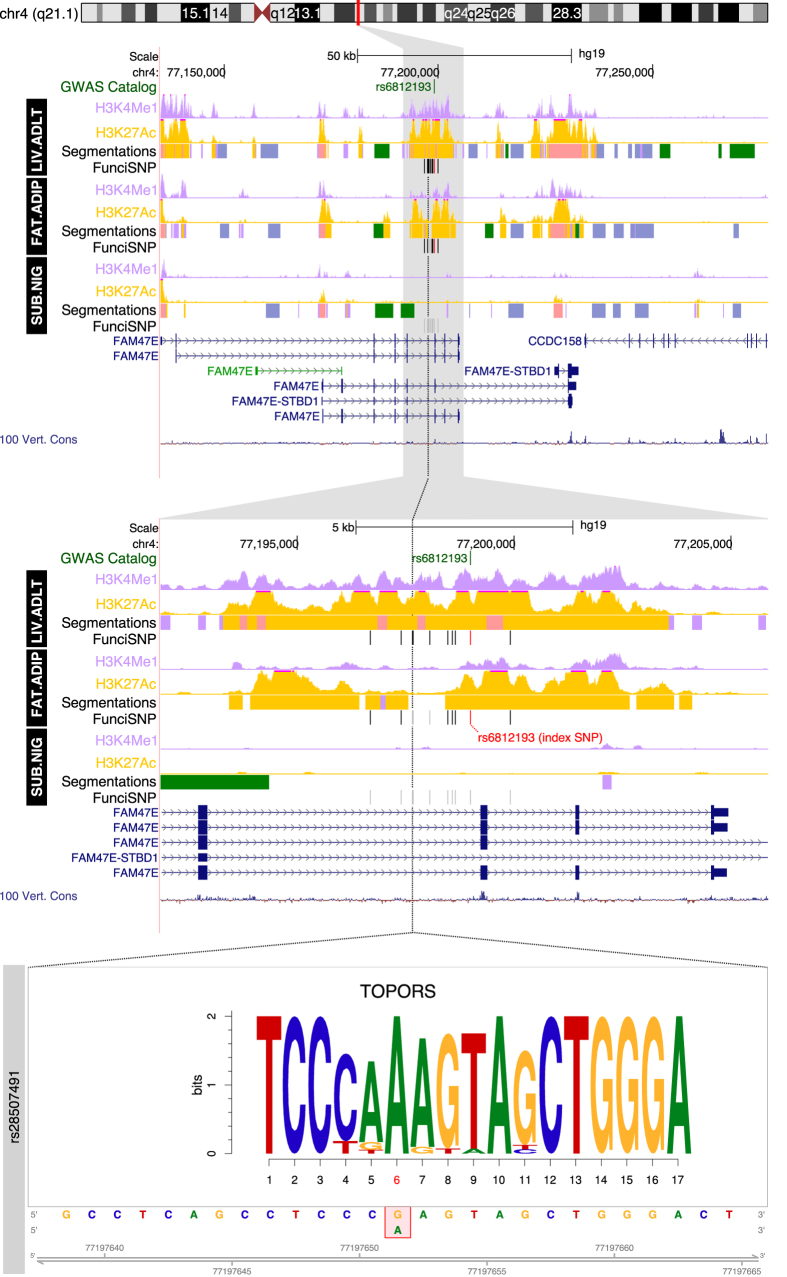
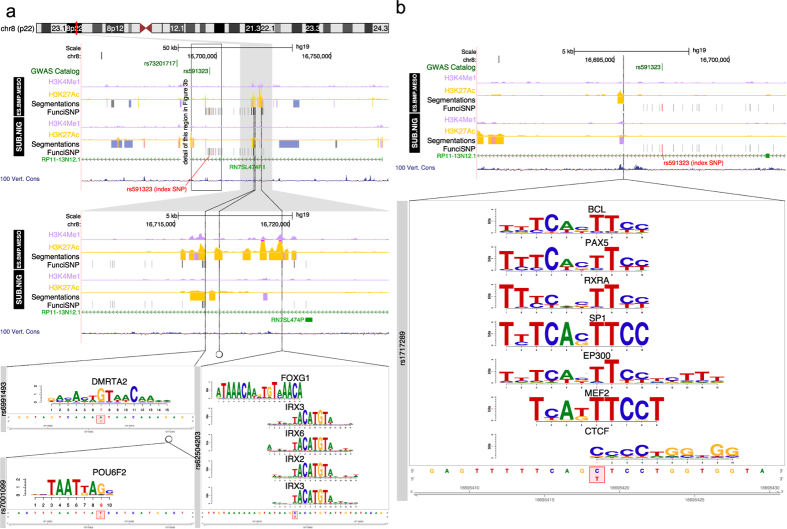
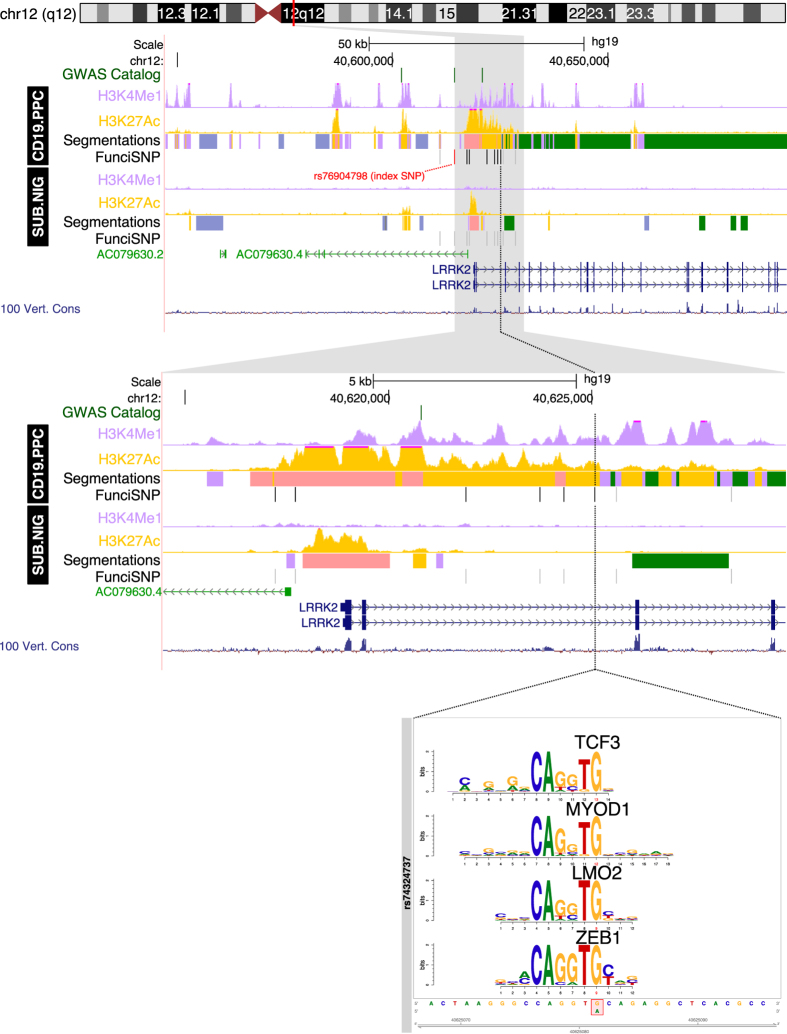
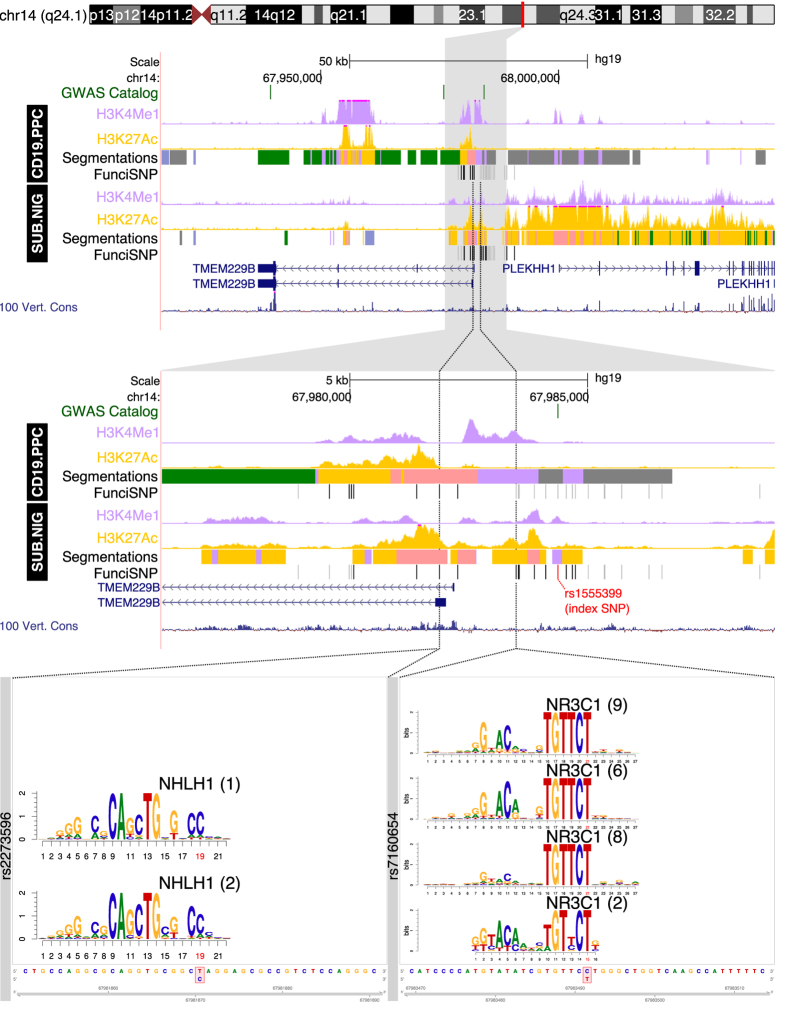
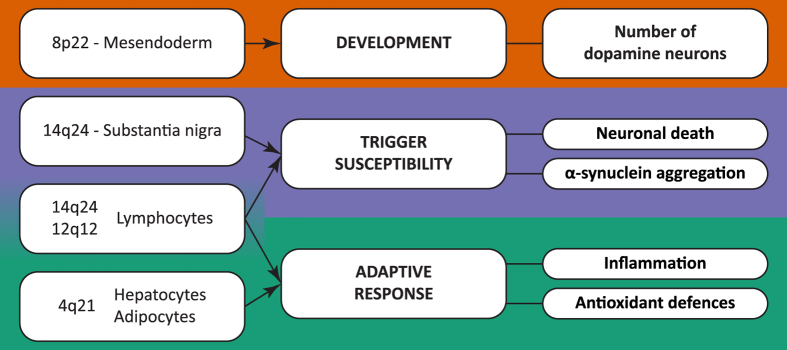
Recent genome-wide association studies (GWAS) of Parkinson's disease (PD) revealed at least 26 risk loci, with associated single nucleotide polymorphisms (SNPs) located in non-coding DNA having unknown functions in risk. In order to explore in which cell types these SNPs (and their correlated surrogates at r(2) ≥ 0.8) could alter cellular function, we assessed their location overlap with histone modification regions that indicate transcription regulation in 77 diverse cell types. We found statistically significant enrichment of risk SNPs at 12 loci in active enhancers or promoters. We investigated 4 risk loci in depth that were most significantly enriched (-logeP > 14) and contained 8 putative enhancers in the different cell types. These enriched loci, along with eQTL associations, were unexpectedly present in non-neuronal cell types. These included lymphocytes, mesendoderm, liver- and fat-cells, indicating that cell types outside the brain are involved in the genetic predisposition to PD. Annotating regulatory risk regions within specific cell types may unravel new putative risk mechanisms and molecular pathways that contribute to PD development.
Figures
Similar articles
-
Parkinson's disease-associated genetic variation is linked to quantitative expression of inflammatory genes.PLoS One. 2017 Apr 13;12(4):e0175882. doi: 10.1371/journal.pone.0175882. eCollection 2017. PLoS One. 2017. PMID: 28407015 Free PMC article.
-
Data integration for functional annotation of regulatory single nucleotide polymorphisms associated with Alzheimer's disease susceptibility.Gene. 2018 Sep 25;672:115-125. doi: 10.1016/j.gene.2018.06.011. Epub 2018 Jun 5. Gene. 2018. PMID: 29883757
-
Cis-regulatory variations: a study of SNPs around genes showing cis-linkage in segregating mouse populations.BMC Genomics. 2006 Sep 15;7:235. doi: 10.1186/1471-2164-7-235. BMC Genomics. 2006. PMID: 16978413 Free PMC article.
-
Systematic enrichment analysis of potentially functional regions for 103 prostate cancer risk-associated loci.Prostate. 2015 Sep;75(12):1264-76. doi: 10.1002/pros.23008. Epub 2015 May 25. Prostate. 2015. PMID: 26015065 Review.
-
Comprehensive review and annotation of susceptibility SNPs associated with obesity-related traits.Obes Rev. 2018 Jul;19(7):917-930. doi: 10.1111/obr.12677. Epub 2018 Mar 12. Obes Rev. 2018. PMID: 29527783 Review.
Cited by
-
Patient-Derived Midbrain Organoids to Explore the Molecular Basis of Parkinson's Disease.Front Neurol. 2020 Sep 4;11:1005. doi: 10.3389/fneur.2020.01005. eCollection 2020. Front Neurol. 2020. PMID: 33013664 Free PMC article. Review.
-
Missing heritability in Parkinson's disease: the emerging role of non-coding genetic variation.J Neural Transm (Vienna). 2020 May;127(5):729-748. doi: 10.1007/s00702-020-02184-0. Epub 2020 Apr 4. J Neural Transm (Vienna). 2020. PMID: 32248367 Free PMC article. Review.
-
Parkinson's disease-associated genetic variation is linked to quantitative expression of inflammatory genes.PLoS One. 2017 Apr 13;12(4):e0175882. doi: 10.1371/journal.pone.0175882. eCollection 2017. PLoS One. 2017. PMID: 28407015 Free PMC article.
-
Rethinking GWAS: how lessons from genetic screens and artificial intelligence could reveal biological mechanisms.Bioinformatics. 2025 Mar 29;41(4):btaf153. doi: 10.1093/bioinformatics/btaf153. Bioinformatics. 2025. PMID: 40198231 Free PMC article.
-
Can infections trigger alpha-synucleinopathies?Prog Mol Biol Transl Sci. 2019;168:299-322. doi: 10.1016/bs.pmbts.2019.06.002. Epub 2019 Jul 3. Prog Mol Biol Transl Sci. 2019. PMID: 31699323 Free PMC article. Review.
References
-
- Braak H. et al. Stanley Fahn Lecture 2005: The staging procedure for the inclusion body pathology associated with sporadic Parkinson’s disease reconsidered. Mov Disord 21, 2042–2051 (2006). - PubMed
-
- Bras J., Guerreiro R. & Hardy J. SnapShot: Genetics of Parkinson’s disease. Cell 160, 570-570 e571 (2015). - PubMed
-
- Kalinderi K., Bostantjopoulou S. & Fidani L. The genetic background of Parkinson’s disease: current progress and future prospects. Acta Neurol Scand (2016). - PubMed
-
- Langston J. W., Schule B., Rees L., Nichols R. J. & Barlow C. Multisystem Lewy body disease and the other parkinsonian disorders. Nat Genet 47, 1378–1384 (2015). - PubMed
Publication types
MeSH terms
Substances
LinkOut - more resources
Full Text Sources
Other Literature Sources
Medical
