. 2016 Sep 23;291(39):20473-86.
doi: 10.1074/jbc.M116.736975. Epub 2016 Jul 26.

A Novel Bifunctional Alkylphenol Anesthetic Allows Characterization of γ-Aminobutyric Acid, Type A (GABAA), Receptor Subunit Binding Selectivity in Synaptosomes

Affiliations

A Novel Bifunctional Alkylphenol Anesthetic Allows Characterization of γ-Aminobutyric Acid, Type A (GABAA), Receptor Subunit Binding Selectivity in Synaptosomes

Kellie A Woll et al. J Biol Chem. .

Abstract

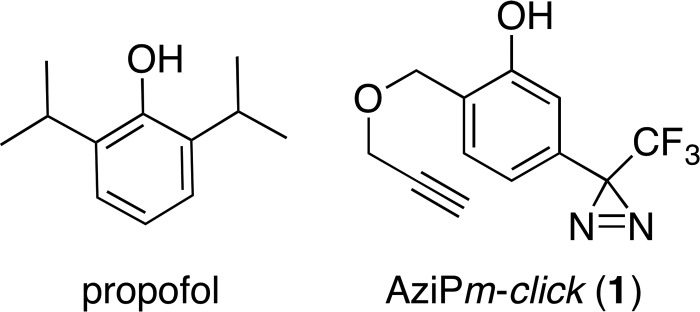
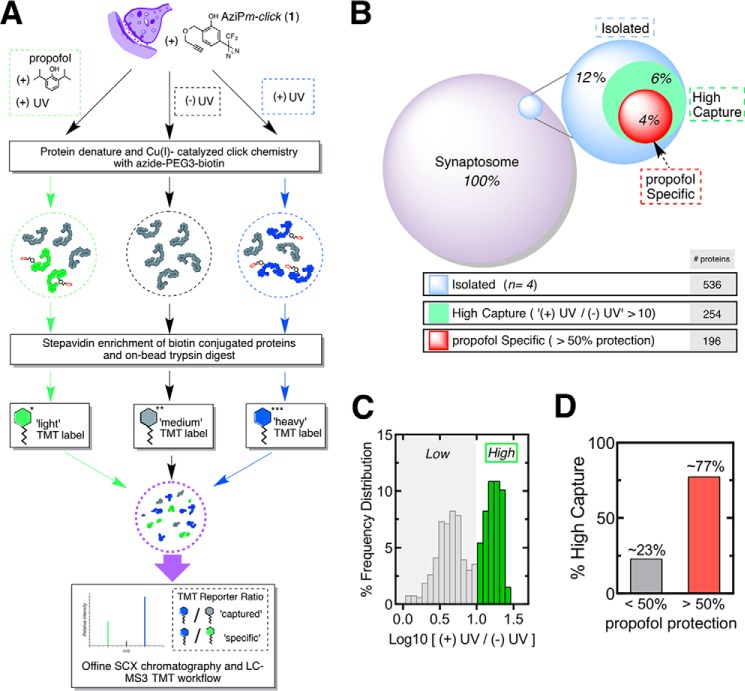
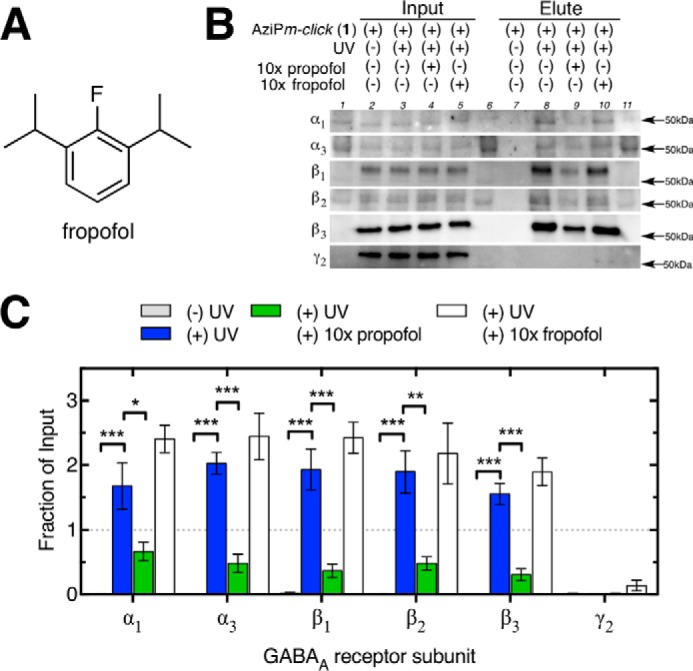
Propofol, an intravenous anesthetic, is a positive modulator of the GABAA receptor, but the mechanistic details, including the relevant binding sites and alternative targets, remain disputed. Here we undertook an in-depth study of alkylphenol-based anesthetic binding to synaptic membranes. We designed, synthesized, and characterized a chemically active alkylphenol anesthetic (2-((prop-2-yn-1-yloxy)methyl)-5-(3-(trifluoromethyl)-3H-diazirin-3-yl)phenol, AziPm-click (1)), for affinity-based protein profiling (ABPP) of propofol-binding proteins in their native state within mouse synaptosomes. The ABPP strategy captured ∼4% of the synaptosomal proteome, including the unbiased capture of five α or β GABAA receptor subunits. Lack of γ2 subunit capture was not due to low abundance. Consistent with this, independent molecular dynamics simulations with alchemical free energy perturbation calculations predicted selective propofol binding to interfacial sites, with higher affinities for α/β than γ-containing interfaces. The simulations indicated hydrogen bonding is a key component leading to propofol-selective binding within GABAA receptor subunit interfaces, with stable hydrogen bonds observed between propofol and α/β cavity residues but not γ cavity residues. We confirmed this by introducing a hydrogen bond-null propofol analogue as a protecting ligand for targeted-ABPP and observed a lack of GABAA receptor subunit protection. This investigation demonstrates striking interfacial GABAA receptor subunit selectivity in the native milieu, suggesting that asymmetric occupancy of heteropentameric ion channels by alkylphenol-based anesthetics is sufficient to induce modulation of activity.

Keywords: GABA receptor; anesthesia; anesthetic; click chemistry; photoaffinity labeling.


Figures

FIGURE 1.
FIGURE 1.
Clickable photoactive propofol analogue. Chemical structures of propofol and AziPm-click (1).
SCHEME 1
SCHEME 1
FIGURE 2.
FIGURE 2.
AziPm-click (1) geometry and photoreactivity. A, ball and stick structure of AziPm-click (1) in predicted lowest energy conformation (gray, carbon; red, oxygen; blue, nitrogen, green, fluorine). B, UV absorption spectra of AziPm-click (1) (175 μm) in double distilled water (black line) over the course of UV irradiation time points (gray and green lines).
FIGURE 3.
FIGURE 3.
Fluorescent profiling of propofol proteome. A, fluorescent image (FL) of SDS-polyacrylamide gel of synaptosomes exposed to AziPm-click (1) with or without UV irradiation and corresponding Coomassie Blue (CB) stain of UV-irradiated synaptosomes. B, protection from AziPm-click (1) labeling of synaptosomes by propofol at 5× (75 μm), 10× (150 μm), 15× (225 μm), and 25× (375 μm). C, chemical structure of ketamine. D, protection from AziPm-click (1) labeling of synaptosomes by ketamine at 10× (150 μm), 20× (300 μm), and 30× (450 μm). All experiments were conducted in triplicate.
FIGURE 4.
FIGURE 4.
α1β2γ2L GABAA receptor and anesthetic activity of AziPm-click (1). A, representative traces of ligand activity on heterologously expressed α1β2γ2L GABAA receptors in X. laevis oocytes. Traces are shown with the oocyte responses to GABA EC10 value and corresponding modulation propofol (3 μm) or AziPm-click (1) (20 μm). B, concentration-response curves for propofol (black circle) and AziPm-click (1) (green diamond) for the positive modulation of heterologously expressed GABAA receptor α1β2γ2L in X. laevis oocytes. Each point represents the mean of four oocytes (n = 4) ± S.E., and data were fitted to a sigmoidal dose-response curve with variable Hill slope. C, dose-response curves for propofol (n = 210; black circle) and AziPm-click (1) (n = 300; green diamond) for loss of spontaneous movement in tadpoles. Data were fitted to a sigmoidal dose-response curve with variable Hill slope, and the EC50 and Hill slope values are represented in Table 3. D, time course of recovery control for X. laevis tadpoles following propofol (n = 30; black open circle) or AziPm-click (1) (n = 30; green open diamond) equilibration and 10 min no UV treatment. E, time course of recovery for tadpoles following propofol (n = 30; black filled circle) or AziPm-click (1) (n = 30; green filled diamond) equilibration and 10 min of low intensity UV irradiation.
FIGURE 5.
FIGURE 5.
Affinity-based propofol profiling of alkylphenol-binding proteins in native synaptosomes. A, scheme for capture and analysis of AziPm-click (1) labeling profiles in synaptosomes by biotin-streptavidin methods, TMT, labeling for relative quantification, strong cation exchange chromatography (SCX), and Nanoliquid chromatography-three-stage mass spectrometry (NanoLC-MS3) analysis. B, distribution of protein groups for the AziPm-click (1) capture and approximate percentage of full synaptosomal proteome, with a summary of the group's threshold requirements. Proteomic experiments were conducted in quadruplicate; the log2 standard deviation between datasets was calculated as 0.28 for heavy over intermediate TMT-labeled samples and 0.17 for heavy over light TMT-labeled samples. C, TMT ratio frequency distribution (log10 scale) of UV versus no UV irradiation with high capture efficiency threshold. D, percent of high capture group proteins that demonstrated less than or greater than 50% protection by propofol.
FIGURE 6.
FIGURE 6.
Intersubunit propofol and AziPm-click (1) occupancy in an α1β3γ2 GABAA receptor as predicted by AutoDock Vina simulations. Helices of the four distinct subunit interface pairs (α1, green; β3, magenta; γ2, blue) with the highest scored docking poses for propofol (orange) and AziPm-click (1) (gray).
FIGURE 7.
FIGURE 7.
Selectivity of intersubunit propofol binding in an α1β3γ2 GABAA receptor as predicted by molecular dynamics simulations using the AFEP algorithm. A, five propofol molecules (colored surfaces) docked in the GABAA receptor subunit interfaces (β+/α− (−2 sites)) are as follows: cyan, α+/β−; violet, α+/γ−; red, γ+/β−, orange. The transmembrane domain is viewed from the extracellular side along the pore axis and colored by subunit type; α1, green; β3, magenta; and γ2, blue. B, computational results for propofol pKD and its likelihood of hydrogen bonding to protein cavity residues (Phb) can be well fit by the line pKD = a (Phb) + b, where a = 3.4 ± 0.8 and b = 3.4 ± 0.1, and the 95% confidence band is shown in gray. C–E, interactions of propofol and water in the high affinity and low affinity interfacial sites. Hydrogen bonds, red dashed lines. C, propofol binding in α+/β− interface that contained seven polar residue side chains (left, side view; right, top view) forms a persistent hydrogen bonding with a backbone carbonyl group exposed by the M1 helical bulge (βLeu-223). D, bound propofol at the β+/α− interfacial site, which contained seven polar residue side chains, (side view) alternates between hydrogen bonds to β+M2:Thr-262 and β+M2:Asn-265. For compactness, the image shows a rare frame in which both hydrogen bonds coexist. E, in the γ+/β− interface eight polar residue side chains were present (top view); these residues favor hydrogen bonding with a water cluster stabilized by polar residues γ+Thr-281 and γ+Ser-301, which are homologous to hydrophobic residues in α and β subunits (see Fig. 7).
FIGURE 8.
FIGURE 8.
Sequence variation in interfacial binding sites of an α1β3γ2 GABAA receptor heteropentamer. A, sequence alignment of + and − subunit interfaces that contribute to the formation of interfacial binding sites. Highlighted residues represent residue side chains that directly contribute to the formation of the binding cavity. Bold and * residues denote key sequence variations in the interfacial binding sites. B and C, helices of the four distinct subunit interface pairs with α+/β− interface as the reference pair. In all panels, side chains are colored by residue type as follows: polar (green), hydrophobic (white), acidic (red), and basic (blue). B, extended view and binding site cavity view of the α+/β− interface reference pair with all cavity contributing side chain residues represented. C, helices of the four distinct subunit interface pairs are colored according to sequence differences with the α+/β− interface as the reference subunit pair displaying identical (light blue), similar (white), and change in residue type (orange). Note that for a given interface, coloring of the + and − subunit backbone reflects sequence differences from α1 and β3, respectively. Cavity residues are labeled according to a prime-numbering system in which M2:16′ is equivalent to Ile-271, Thr-266, and Thr-281 for α1, β3, and γ2 subunits, respectively; M3:19′ is Tyr-294, Phe-289, and Phe-304 and M3:22′ is Ala-291, Met-286, and Ser-301 with the same ordering.
FIGURE 9.
FIGURE 9.
Ligand protection of synaptic GABAA receptor capture. A, chemical structure of fropofol. B, representative Western blots for GABAA receptor subunits of input (lanes 2–5) and the corresponding elution (lanes 7–10) for synaptosomal samples exposed to AziPm-click (1) (10 μm) with or without UV irradiation and with or without co-exposure with propofol (100 μm) or fropofol (100 μm). Lanes 1, 6, and 11 contain protein ladders. B, comparison of non-UV and UV capture with or without propofol or fropofol protection for each GABAA receptor subunit; values are represented as the mean of four experiments ± S.E. of the fraction of the corresponding input sample. Data were analyzed by two-way analysis of variance with Tukey's multiple comparison test comparing fraction captured between protection conditions for each subunit. Significant differences compared with UV-irradiated eluate preparation without protection ligand are shown (***, p < 0.001; **, p < 0.01; *, p < 0.05).

Similar articles

Cited by

References

    1. Olsen R. W., and Sieghart W. (2008) International union of pharmacology. LXX. Subtypes of γ-aminobutyric acid(A) receptors: classification on the basis of subunit composition, pharmacology, and function. Update. Pharmacol. Rev. 60, 243–260 - PMC - PubMed
    1. Wu X., Wu Z., Ning G., Guo Y., Ali R., Macdonald R. L., De Blas A. L., Luscher B., and Chen G. (2012) γ-Aminobutyric acid type A (GABA A) receptor α subunits play a direct role in synaptic versus extrasynaptic targeting. J. Biol. Chem. 287, 27417–27430 - PMC - PubMed
    1. Hentschke H., Benkwitz C., Banks M. I., Perkins M. G., Homanics G. E., and Pearce R. A. (2009) Altered GABAA, slow inhibition and network oscillations in mice lacking the GABAA receptor β3 subunit. J. Neurophysiol. 102, 3643–3655 - PMC - PubMed
    1. Kullmann D. M., Ruiz A., Rusakov D. M., Scott R., Semyanov A., and Walker M. C. (2005) Presynaptic, extrasynaptic and axonal GABA(A) receptors in the CNS: where and why? Prog. Biophys. Mol. Biol. 87, 33–46 - PMC - PubMed
    1. Baumann S. W., Baur R., and Sigel E. (2001) Subunit arrangement of γ-aminobutyric acid type A receptors. J. Biol. Chem. 276, 36275–36280 - PubMed

Publication types

LinkOut - more resources