. 2016 Sep;172(1):489-509.
doi: 10.1104/pp.16.00530. Epub 2016 Jul 26.

Cytokinins Are Initial Targets of Light in the Control of Bud Outgrowth

Affiliations

Cytokinins Are Initial Targets of Light in the Control of Bud Outgrowth

Hanaé Roman et al. Plant Physiol. 2016 Sep.

Abstract

Bud outgrowth is controlled by environmental and endogenous factors. Through the use of the photosynthesis inhibitor norflurazon and of masking experiments, evidence is given here that light acts mainly as a morphogenic signal in the triggering of bud outgrowth and that initial steps in the light signaling pathway involve cytokinins (CKs). Indeed, in rose (Rosa hybrida), inhibition of bud outgrowth by darkness is suppressed solely by the application of CKs. In contrast, application of sugars has a limited effect. Exposure of plants to white light (WL) induces a rapid (after 3-6 h of WL exposure) up-regulation of CK synthesis (RhIPT3 and RhIPT5), of CK activation (RhLOG8), and of CK putative transporter RhPUP5 genes and to the repression of the CK degradation RhCKX1 gene in the node. This leads to the accumulation of CKs in the node within 6 h and in the bud at 24 h and to the triggering of bud outgrowth. Molecular analysis of genes involved in major mechanisms of bud outgrowth (strigolactone signaling [RwMAX2], metabolism and transport of auxin [RhPIN1, RhYUC1, and RhTAR1], regulation of sugar sink strength [RhVI, RhSUSY, RhSUC2, and RhSWEET10], and cell division and expansion [RhEXP and RhPCNA]) reveal that, when supplied in darkness, CKs up-regulate their expression as rapidly and as intensely as WL Additionally, up-regulation of CKs by WL promotes xylem flux toward the bud, as evidenced by Methylene Blue accumulation in the bud after CK treatment in the dark. Altogether, these results suggest that CKs are initial components of the light signaling pathway that controls the initiation of bud outgrowth.


Figures

Figure 1.
Figure 1.
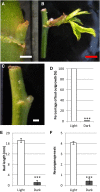
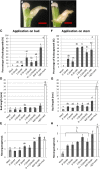
Effects of light environment on bud outgrowth in rose. A to C, Bud on the day of decapitation (Tdecap; A) and 7 d after WL (B) or dark (C) exposure. Red bar = 5 mm, and white bars = 1 mm. D, Percentage of bud outgrowth. E, Bud length. F, Neoorganogenesis after 7 d. Data are means ± se; n = 3 biological replicates with at least 10 plants per replicate. Asterisks indicate significant differences between light and dark conditions (P < 0.001).
Figure 2.
Figure 2.
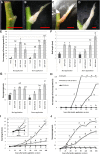
Effects of partial masking and of photosynthesis inhibition on bud outgrowth in rose. A to H, Percentage of bud outgrowth (A), bud length (B), and neoorganogenesis after 7 d (C) with bud and stem exposed to light (white columns, light treatment; D), or bud only exposed to light and stem placed under darkness using foil (light gray columns, bud in light/stem in dark; E), or bud placed in dark and the entire stem in light (dark gray columns, bud in dark/stem in light; F), or entire plant placed in dark (black columns, dark treatment, dark bag removed; H). Bud outgrowth occurred only when the bud itself was exposed to WL (D and E). Masking the bud with translucent material as a control allowed bud outgrowth as shown in G, where the strength of bud growth made even bud leaves protrude through the translucent material. Control plants for D and H with a translucent bag over the entire plant were published by Girault et al. (2008), showing that enclosing the plant in such a bag had no effect on the bud’s capacity to grow out. I to R, Effect of norflurazon (500 µm) on bud outgrowth. In mock-treated plants (I–M), buds were green on the day of decapitation (I). Upon decapitation and exposure to WL, bud grew out and produced green leaves (J and K). Young green leaves are shown after the removal of older leaves and observation with a binocular microscope (K). Chlorophyll in these young leaves gives a red signal under UV light (L) and a blue signal by confocal microscopy (M). The square in J corresponds to M. Application of the photosynthesis inhibitor norflurazon 4 d before decapitation produced bleached bud due to the destruction of the chlorophyll on the day of decapitation (N). This bleached bud grew out even when norflurazon treatment was pursued for 7 d after decapitation (O). Leaves that expanded from the treated bud were white (P) and deprived of chlorophyll, as shown using UV light using a binocular microscope (Q) and by confocal microscopy (R; corresponding to the white square in O). Data are means ± se; n = 3 biological replicates with at least 10 plants per replicate. Letters indicate significant differences by ANOVA between treatments. Red bars = 5 mm, black bars = 0.5 mm, and white bars = 100 µm.
Figure 3.
Figure 3.
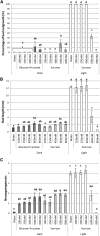
Effects of sugar feeding under darkness or WL on bud outgrowth. Sugars (Glc+Fru or Suc) were applied on the cut end of the stem in a lanoline drop at 100 mm or in aqueous solution for higher concentrations (250, 400, 600, and 800 mm) as in Supplemental Figure S1, C and D. Under WL, with water or sugar feeding up to 400 mm, all buds had grown out after 7 d, but sugar concentrations of 600 and 800 mm were detrimental in this condition, with reduction in percentage bud outgrowth (A), bud length (B), and neoorganogenesis (C). Under darkness, buds remained dormant when fed with water or with sugars up to 400 mm (A). When fed with Glc+Fru or with Suc at 600 mm, most buds remained dormant, but some (10% or 20%, respectively) grew out (A). Elongation of bud, however, was reduced (1 mm; B). Neoorganogenesis was promoted by sugar feeding at higher concentrations (C). Data are means ± se; n = 3 biological replicates with at least 10 plants per replicate. Letters indicate significant differences by ANOVA.
Figure 4.
Figure 4.
RhARR3 (A and B) and RhARR5 (C and D) expression in bud and corresponding node from decapitation to 48 h under WL or dark treatment. Relative expression is shown just prior to decapitation (Tdecap), after a 24-h dark treatment following decapitation (T0), and after 3, 6, 24, and 48 h of WL (white columns) or further dark (black columns) exposure after T0. Some of the dark-exposed plants also were treated with BAP (10 mm) on the bud at T0 (gray columns). Data are means ± se of three independent batches with 50 < n < 80 buds or n = 20 for node samples. Letters represent significant differences by ANOVA.
Figure 5.
Figure 5.
CK contents in bud and node under WL or dark treatment. Levels of trans-zeatin (tZ) type (A, C, E, and G) and of isopentenyladenine (iP) type (B, D, F, and H) CK are shown in bud and node tissues at T0 (gray bars) and following 6 and 24 h of WL (white bars) or of dark (black bars) treatment. Data show the total contents of tZ and iP types (A and B) and detailed levels of active (base) tZ (C) and iP (D) forms, of riboside tZR (E) and iPR (F) forms, and of nucleotide forms tZRMP (G) and iPRMP (H). Data are for 1 g of extracted tissue (pmol g−1; means ± sd). Letters indicate significant differences by ANOVA between conditions for one given tissue.
Figure 6.
Figure 6.
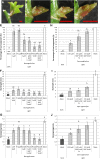
Effects of CK treatments under darkness on bud outgrowth. A to D, Buds 7 d (A–C) or 15 d (D) after treatment with a lanolin drop containing either only the solvent (mock; A) or a synthetic CK (BAP; 10 mm) applied on the bud (B) or on the stem (C and D). Red bars = 5 mm. E to G, Effects of BAP (1, 10, and 30 mm) applied on the bud and BAP (0.05, 1, and 10 mm) applied on the stem on the percentage of bud outgrowth (E), bud length (F), and neoorganogenesis (G) 7 d after BAP treatments. H to J, Kinetics of bud outgrowth (H), bud elongation (I), and neoorganogenesis (J) under WL and darkness with or without BAP (10 mm in lanolin) stem treatment under darkness. Data are means ± se; n = 3 biological replicates with at least 15 plants per replicate. Letters indicate significant differences by ANOVA between the different concentrations in one tissue (E–G) and between the three conditions for the same time point (H–J).
Figure 7.
Figure 7.
Effects of CK inhibitors (LGR-991 and PI-55 for perception and lovastatin [LVS] for synthesis) on bud outgrowth under WL. Inhibitors were applied alone or combined with BAP at T0. In one case, LVS treatment at T0 was followed by BAP treatment alone after 3 d. Perception inhibitors were applied on the bud, while the synthesis inhibitor was applied on the cut end of the stem, and plants were cultured for 7 d under WL. A to D, Bud treated by mock (A), LRG-991 (B), PI-55 (C), and LVS (D) at 1 µm each and after 7 d. Red bars = 3 mm. E and H, Percentage of bud outgrowth. F and I, Bud length. G and J, Neoorganogenesis after 7 d. Data are means ± se; n = 3 biological replicates with at least 15 plants per replicate. Letters indicate significant differences by ANOVA. For stem application of PI-55 and LGR-991 and bud application of LVS, see Supplemental Figure S1, A to C.
Figure 8.
Figure 8.
Effects of the natural CKs isopentenyladenine (iP) and zeatin (Z) on bud outgrowth in darkness. Plants were treated with a lanolin drop containing only the solvent (mock), iP (A), or Z (B) applied on the bud (C–E) or on the cut end of the stem (A, B, and F–H). Bud outgrowth was observed 7 d after treatments. A and B, Bud treated by iP (A) and Z (B). Red bars = 5 mm. C and F, Percentage of bud outgrowth. D and G, Bud length. E and H, Neoorganogenesis. Black and gray columns represent dark treatment, and white columns correspond to WL treatment. Data are means ± se; n = 3 biological replicates with at least 10 plants per replicate. Letters indicate significant differences by ANOVA. Red bars = 5 mm.
Figure 9.
Figure 9.
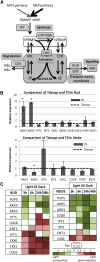
Effects of decapitation and light environment on CK-related genes. A, Simplified isoprenoid CK biosynthesis pathways. CK precursors originate from two pathways: the mevalonate (MVA) and the methylerythritol phosphate (MEP) pathways, both producing dimethylallyl-diphosphate (DMAPP). The ADENOSINE PHOSPHATE-ISOPENTENYLTRANSFERASES (IPT; Kakimoto 2001; Takei et al., 2001; Miyawaki et al., 2004) uses AMP, ATP, or ADP to form isopentenyladenosine-5′-monophosphate (iPRMP), IPRTP, and iPRDP, respectively. The cytochrome P450 CYP735A (Takei et al., 2004) catalyzes the next step where the iP nucleotides (iPRMP) are converted in zeatin nucleotides (tZRMP). The last step involves the LONELY GUY (LOG; Kurakawa et al., 2007) enzymes, which convert the nucleotide forms in active forms: isopentenyladenine (iP) and trans-zeatin (tZ). The iP and tZ ribosides and bases can be inactivated in an irreversible manner by the CYTOKININ OXIDASES (CKX; Whitty and Hall, 1974; Schmülling et al., 2003), which catabolized them into adenine (Ade) and adenosine (Ado). CK transport from cell to cell across the plasma membrane is achieved with the help of two families of transporters: the purine permease family (PUP), which transports free-base CKs (iP and tZ), and the equilibrative nucleoside transporters family (ENT), which transports CK ribosides (iPR and tZR; Kudo et al., 2010). CK perception at the plasma membrane involves a phosphorylation cascade from the receptor His kinase to His phosphotransferase, which finally activates Arabidopsis response regulators (ARR). This image is modified from Sakakibara (2006), Frébort et al. (2011), El-Showk et al. (2013), and Kieber and Schaller (2014). B, Effects of decapitation on the expression of CK-related genes in bud and node tissues: CK synthesis (RhIPT3/5), activation (RhLOG3/8), degradation (RhCKX1/6), and putative transport (RhPUP5 and RhENT1) genes. Gene expression after decapitation and 24 h of dark treatment (T0; black bars) is expressed relative to expression on the day of decapitation (Tdecap; dotted lines) for each gene. Data are means ± se of three batches with 50 < n < 80 buds or n = 20 for node samples. Significant differences are represented by asterisks between T0 and Tdecap (P < 0.05). C, Evolution of the expression of CK-related genes from 3 to 48 h after T0 under WL or dark treatment. Changes in transcript levels are indicated by color codes: green indicating an increased expression under WL and red indicating an increased expression under darkness compared with T0. A color log scale is included at bottom right. All the qPCR data used to build these tables are shown in Supplemental Figure S3.
Figure 10.
Figure 10.
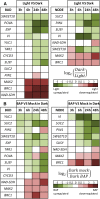
Evolution of the expression of genes involved in the control of bud outgrowth in the node and in the bud from 3 to 48 h after T0 under WL or dark treatment (A) or following bud treatment with BAP (10 mm) under darkness (B). Changes in transcript levels are indicated by color codes. In A, green indicates promotion by WL of gene expression, while red shows promotion by darkness compared with T0. In B, green indicates promotion by BAP treatment of gene expression, while red indicates repression of gene expression by BAP treatment compared with T0. Two color log scales are included. Transcript levels were obtained from three batches with 50 < n < 80 buds or n = 20 for node samples. All qPCR data used to build these tables are shown in Supplemental Figure S4.
Figure 11.
Figure 11.
Activation by WL or BAP under darkness of vascular connections between bud and corresponding node during outgrowth. Plants treated or not with BAP (10 mm) on the cut end of the stem were placed under WL or darkness for 24 h up to 196 h. Roots were then soaked in Methylene Blue during 3 h under WL, and buds were observed. A to C, Bud and node at T0 showing no active vascular connection. A, Longitudinal section of the stem. B, Transverse section of the stem. No accumulation of Methylene Blue is observed at T0 in the bud, even though Methylene Blue is well transported by stem xylem. C, Same section after carmino-green staining showing xylem tissue in green. D to F, When the plant is exposed to WL from T0, the accumulation of Methylene Blue is already visible in bud scales at 24 h (D) and pursued at 72 h (E) and 120 h (F). G, From 96 h, the accumulation of Methylene Blue also is visible in the leaves but not in the leaf primordia. H, Under darkness, bud remains dormant and no accumulation of Methylene Blue is ever observed in the bud, even after 196 h. I, When BAP is applied under darkness, this leads as early as 24 h after treatment to active xylem connection between the node and the bud, as evidenced by Methylene Blue accumulation in the vascular tissues of bud scales. J, Percentages of buds showing Methylene Blue in scales and in leaves after light or CK treatment in darkness. Observations were made with a binocular microscope. Red arrows indicate the accumulation of Methylene Blue, and black arrows indicate bud. Data are means ± se from three to five biological replicates, with n = 5 to 10 plants per replicate. Letters indicate significant differences by ANOVA between the three conditions for the same time point. White bars = 1 mm, and red bars = 0.1 mm.
Figure 12.
Figure 12.
Model for the roles of CKs in the photocontrol of bud outgrowth in rose. After decapitation, perception by the axillary bud of favorable light conditions leads to the transduction of a photomorphogenic signal toward the corresponding node. This signal promotes the accumulation of CK in the node through rapid (3–6 h) stimulation of CK synthesis (RhIPT3 and RhIPT5) and activation (RhLOG8) genes together with repression of the CK degradation gene RhCKX1. Transport of these neosynthesized CKs toward the bud may be promoted by the putative CK transporter RhPUP5, the transcription of which is enhanced by WL as soon as 3 h after light perception. In the bud, incoming CKs are preserved from degradation, since light inhibits expression of the CK degradation genes RhCKX1 and RhCKX6. In both node and bud, neosynthesized CKs trigger a CK signal involving enhanced expression of the CK signaling genes RhARR3 and RhARR5 already at 3 h. The light-promoted CK signal then acts over several key actors of bud outgrowth: inhibition of the SL signaling gene RwMAX2 and of the central negative regulator RhBRC1 in both bud and node and increased sugar sink strength of bud through activation of the Suc transporters RhSUC2 and RhSWEET10, of the Suc synthase RhSUSY, and of the vacuolar invertase RhVI. The simple sugars (Glc and Fru) provided to the bud contribute to bud outgrowth together with enhanced expression of the cell division gene RhPCNA and of the cell wall expansion gene RhEXP by CK signal. RhCYCD3 also contributes to this growth; its expression is promoted by WL, independently of CK. The light-promoted CK signal also promotes auxin (IAA) accumulation in bud, as measured at 24 h through stimulation of the auxin synthesis genes RhYUC1 and RhTAR1 in the bud. The export of this neosynthesized auxin toward the node is permitted because auxin depletion in the node has occurred after decapitation, a process to which light-promoted CK signal may contribute to enhancing the expression of the auxin efflux gene RhPIN1 in the node. The initial (3–6 h) impact of light over CK genes and CK accumulation as well as the rapid effects of the light-promoted CK signal over several mechanisms controlling bud outgrowth suggest that CKs are an initial and upstream component of the light signaling pathway. Other molecular targets of light independent of CK exist, as shown for RhCYCD3 that takes part in the regulation of bud outgrowth. However, the capacity of CK-derived light signal to trigger a complete process leading to bud outgrowth (bud elongation and organogenic activity of the meristem) suggests that CKs drive a main part of the light regulation of bud outgrowth.

References

    1. Aguilar-Martínez JA, Poza-Carrión C, Cubas P (2007) Arabidopsis BRANCHED1 acts as an integrator of branching signals within axillary buds. Plant Cell 19: 458–472 - PMC - PubMed
    1. Alberts AW. (1988) Discovery, biochemistry and biology of lovastatin. Am J Cardiol 62: 10J–15J - PubMed
    1. Antoniadi I, Plačková L, Simonovik B, Doležal K, Turnbull C, Ljung K, Novák O (2015) Cell-type-specific cytokinin distribution within the Arabidopsis primary root apex. Plant Cell 27: 1955–1967 - PMC - PubMed
    1. Balla J, Kalousek P, Reinöhl V, Friml J, Procházka S (2011) Competitive canalization of PIN-dependent auxin flow from axillary buds controls pea bud outgrowth. Plant J 65: 571–577 - PubMed
    1. Bangerth F. (1994) Response of cytokinin concentration in the xylem exudate of bean (Phaseolus vulgaris L.) plants to decapitation and auxin treatment, and relationship to apical dominance. Planta 194: 439–442

Publication types

MeSH terms

LinkOut - more resources