. 2016 Aug 9;113(32):E4671-80.
doi: 10.1073/pnas.1602419113. Epub 2016 Jul 26.

AIM2 inflammasome is activated by pharmacological disruption of nuclear envelope integrity

Affiliations

AIM2 inflammasome is activated by pharmacological disruption of nuclear envelope integrity

Antonia Di Micco et al. Proc Natl Acad Sci U S A. .

Abstract

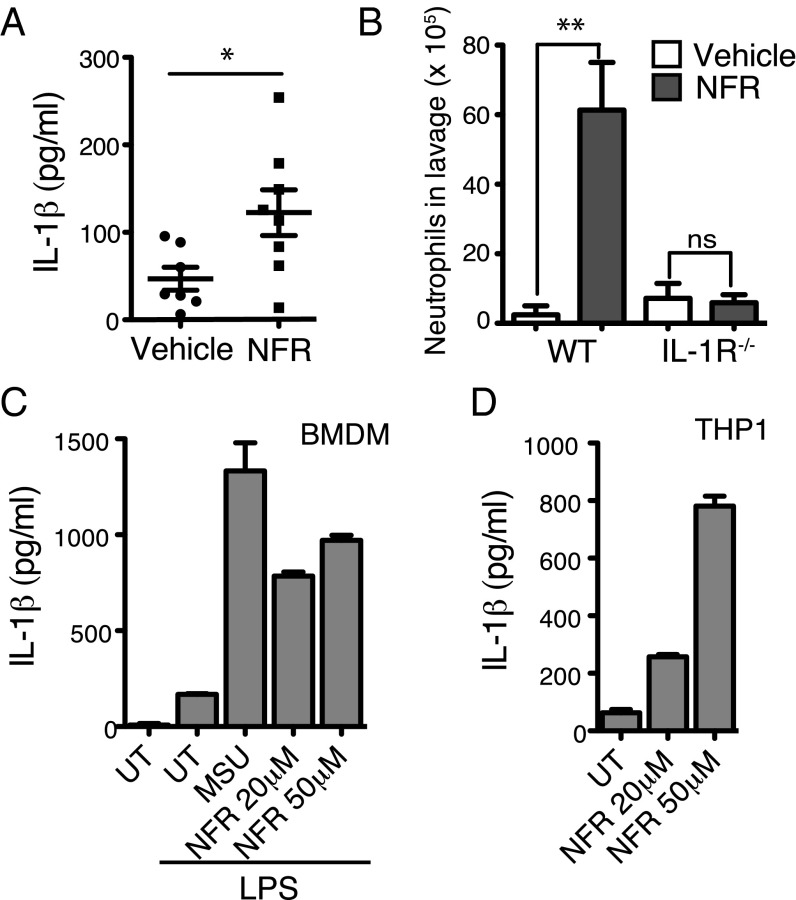
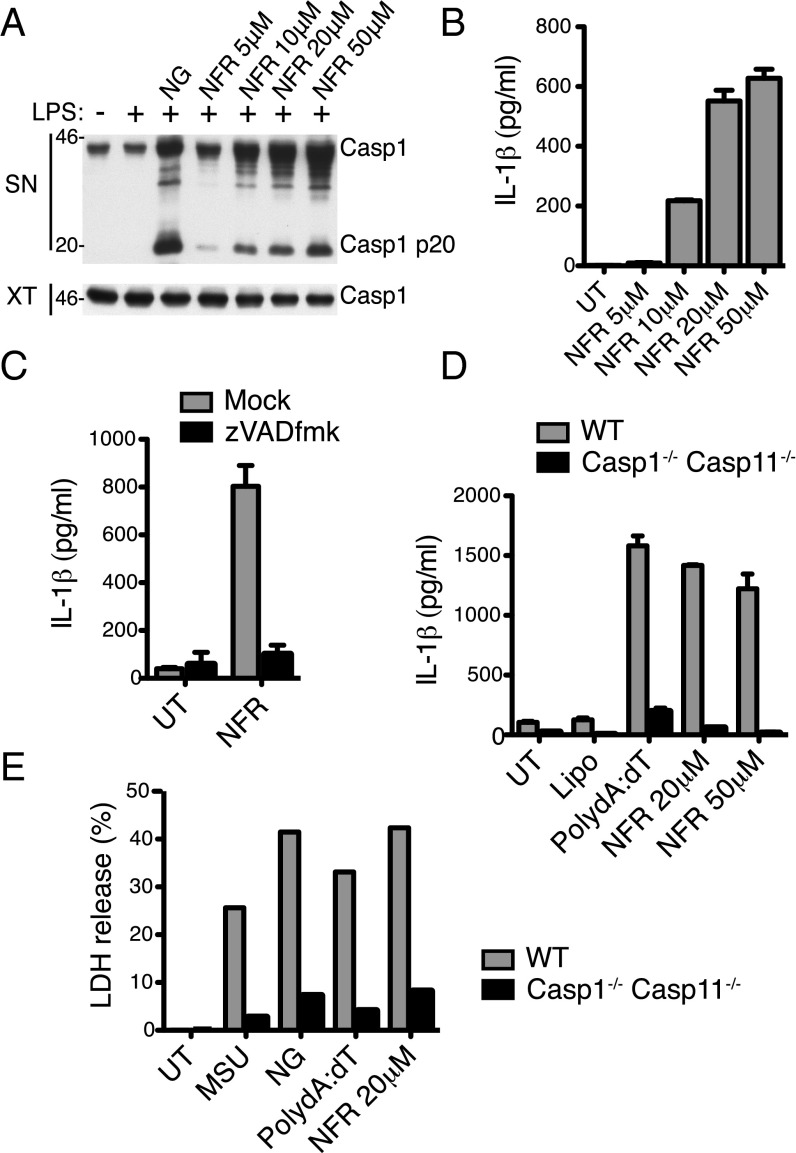
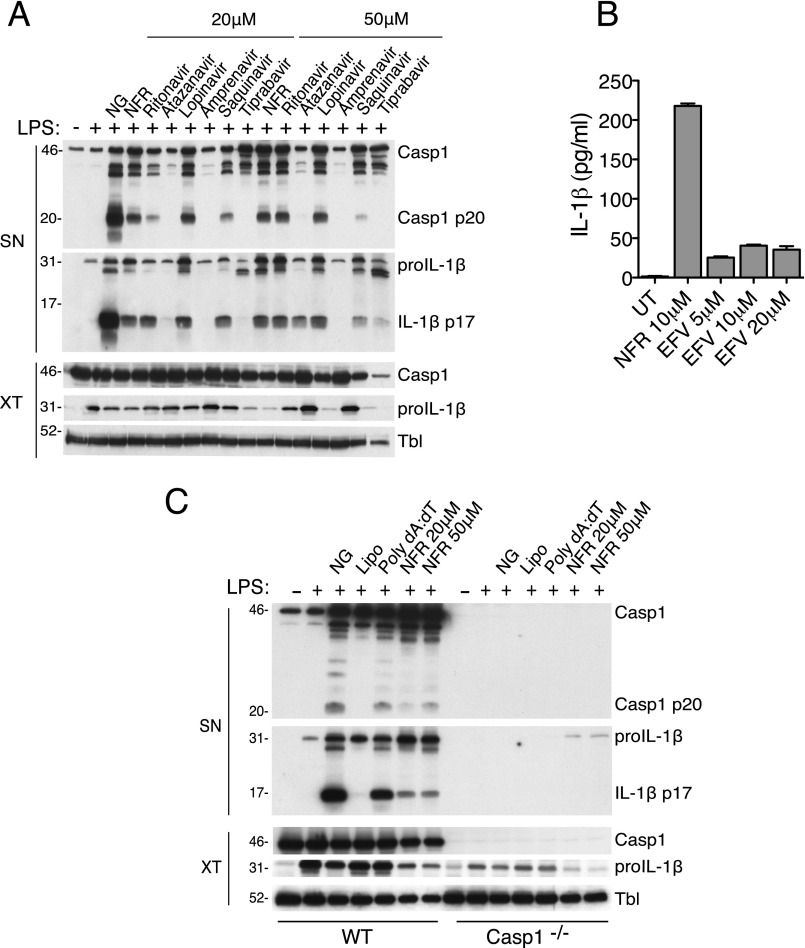
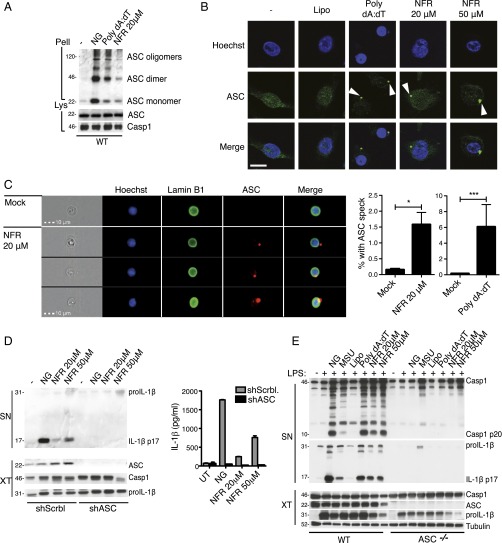
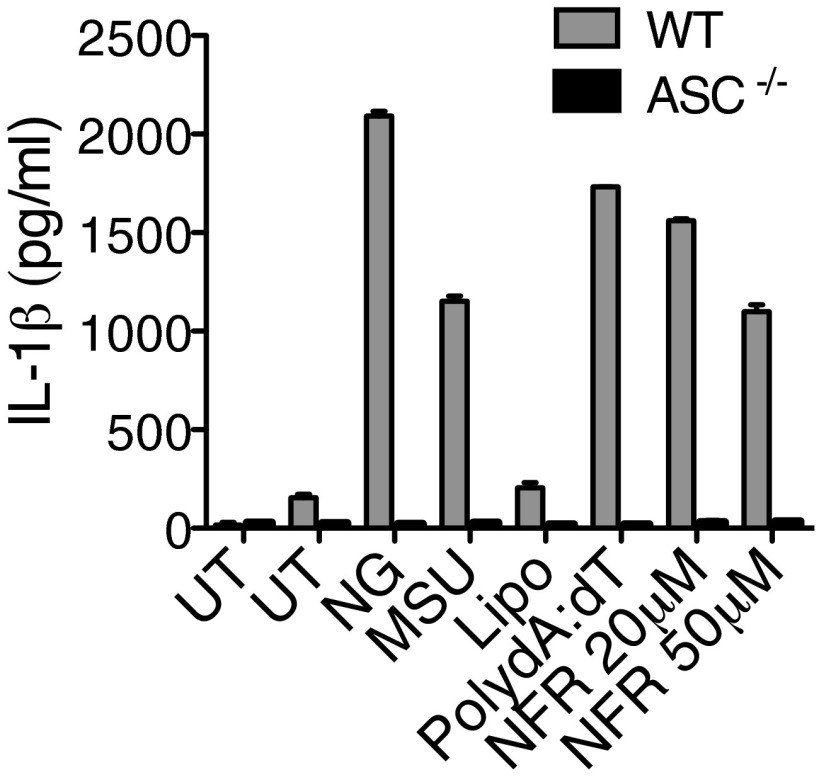
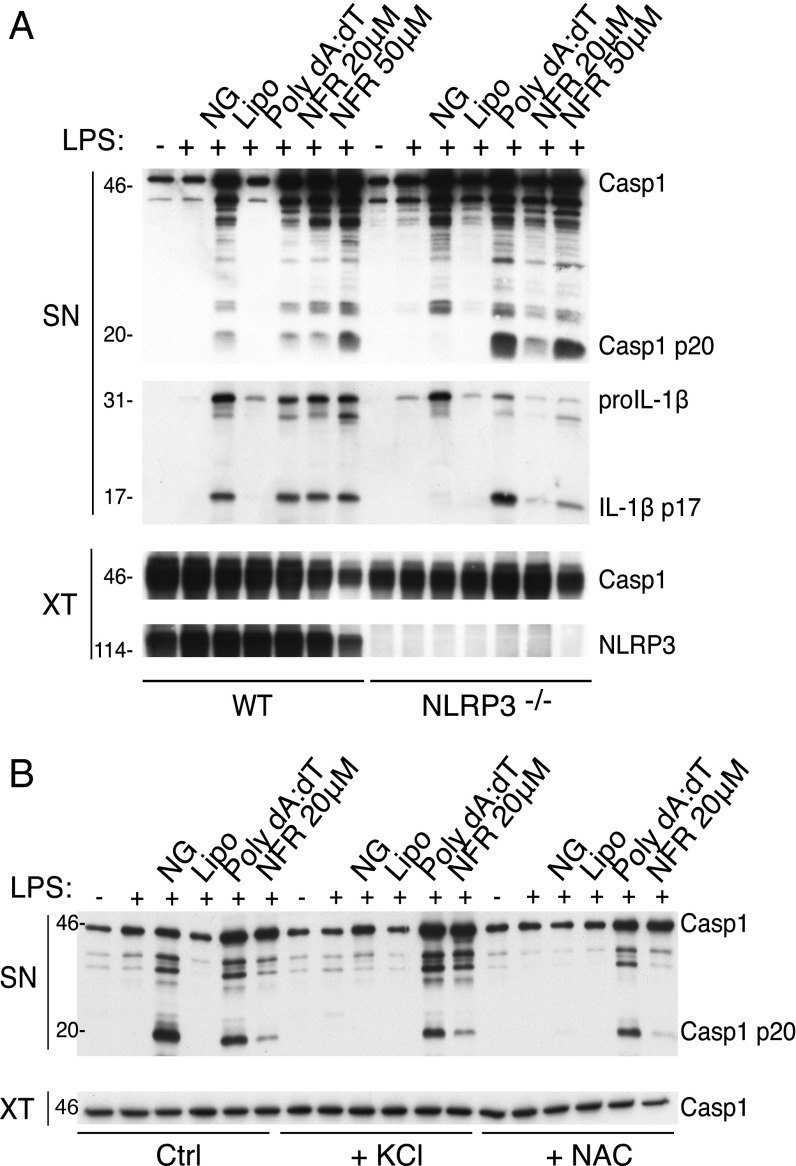
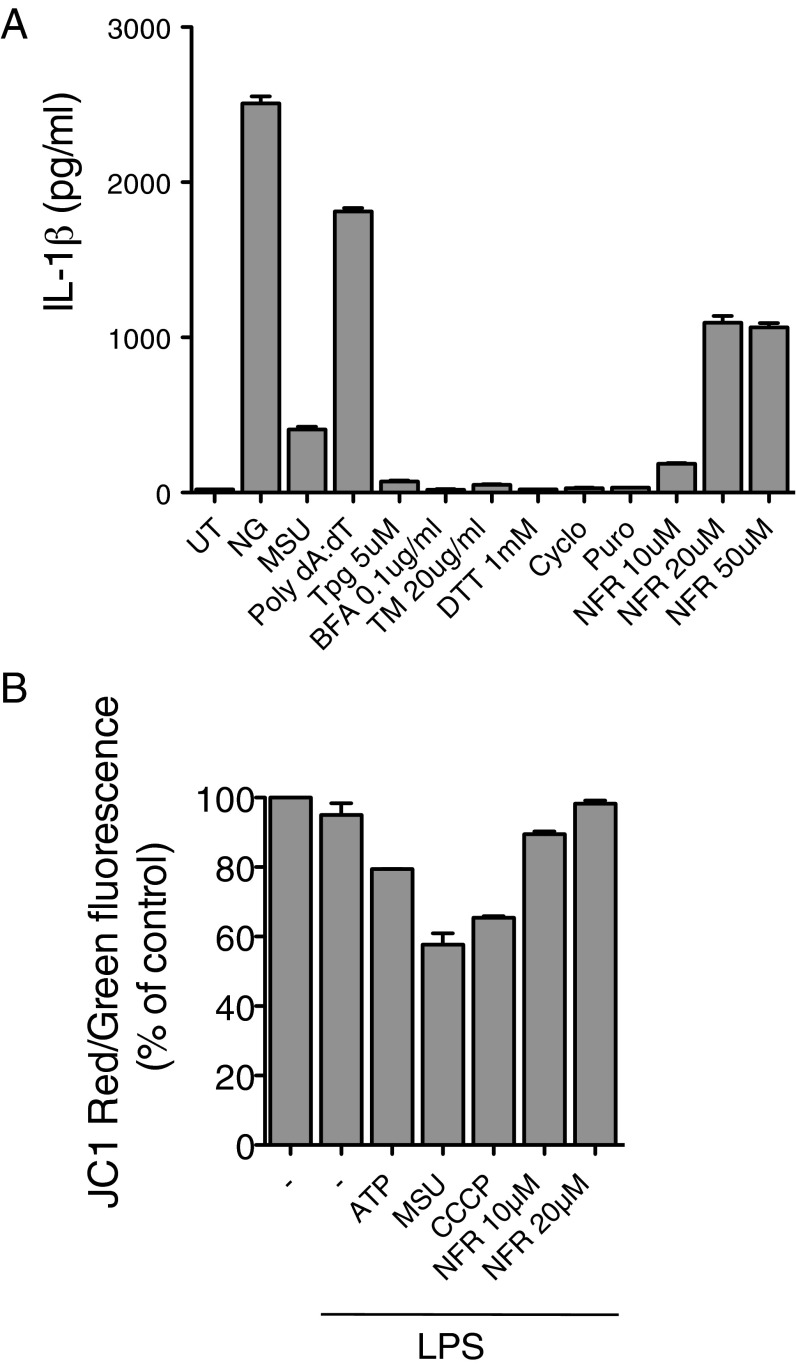
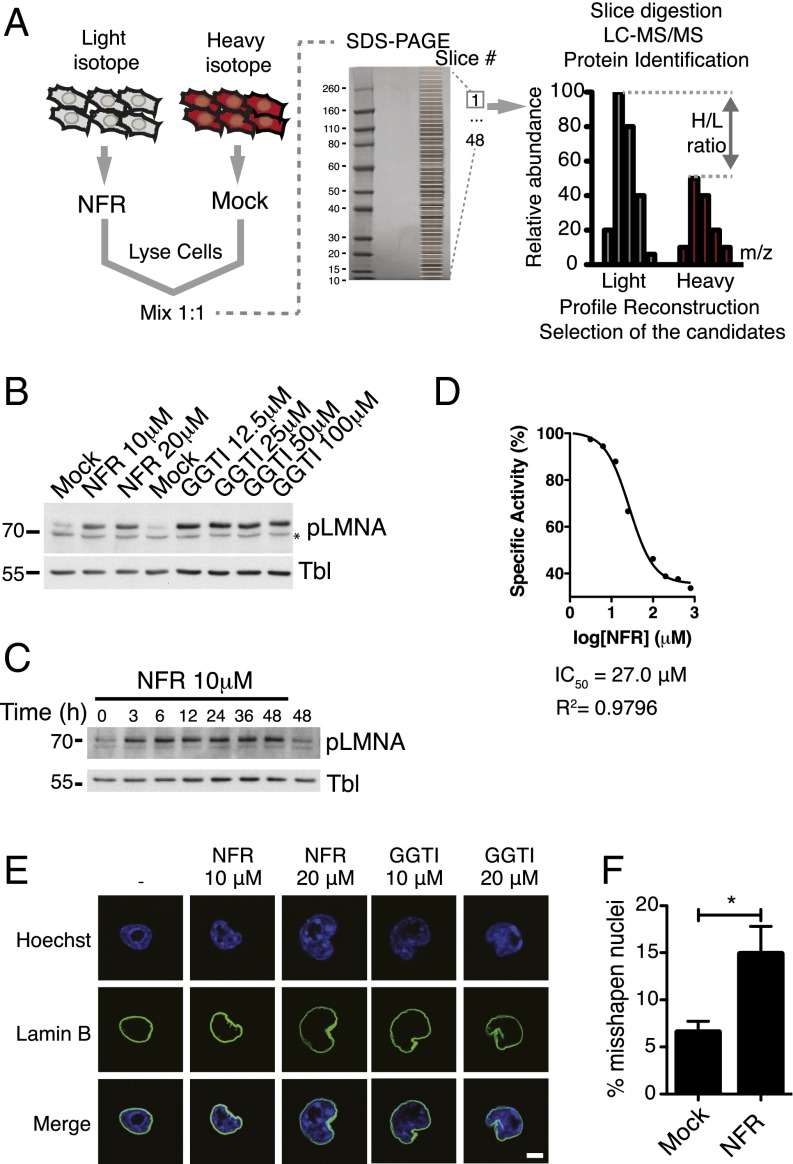
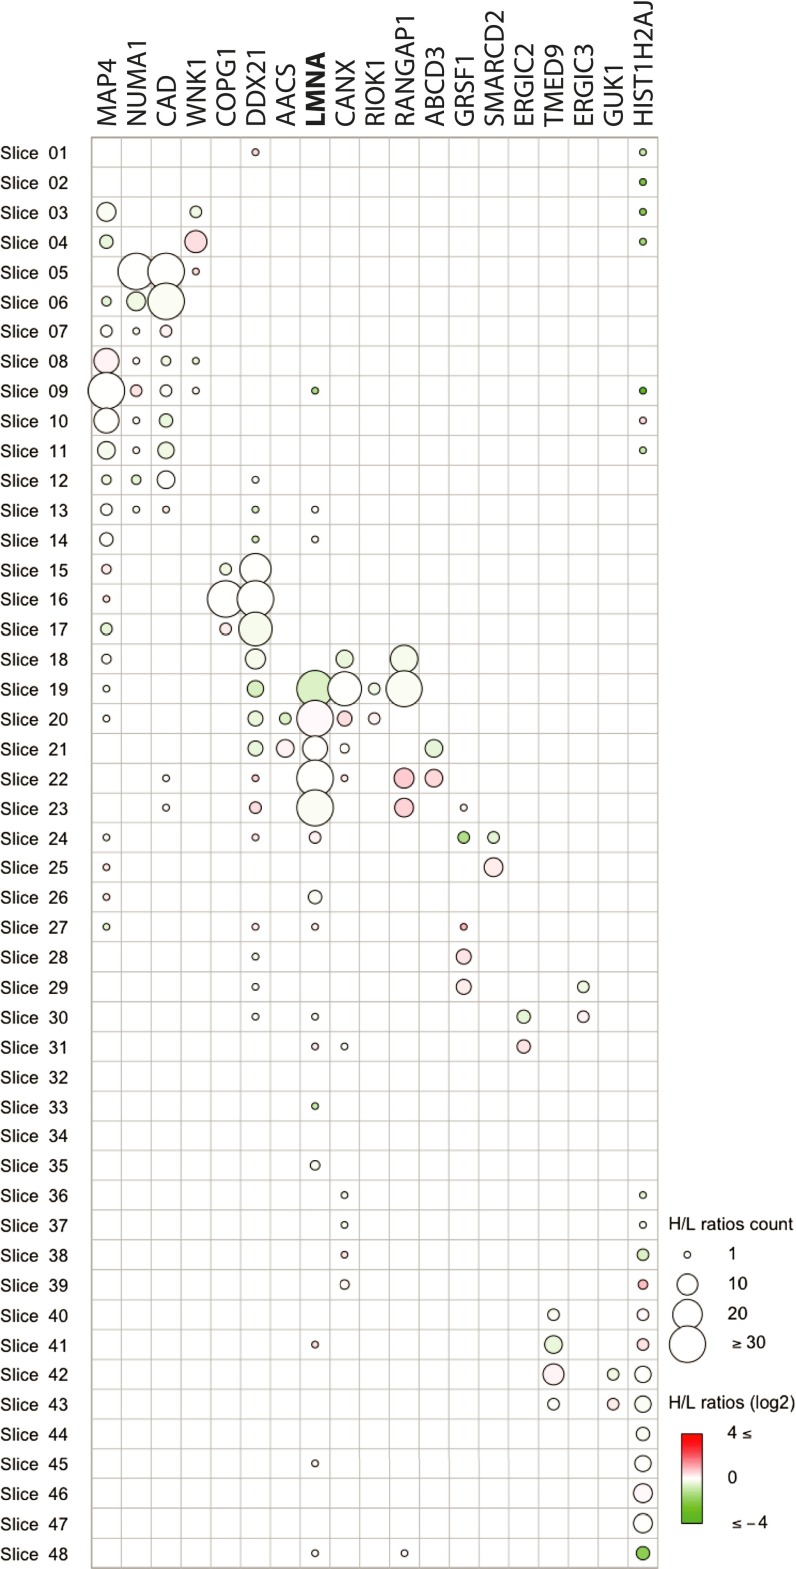
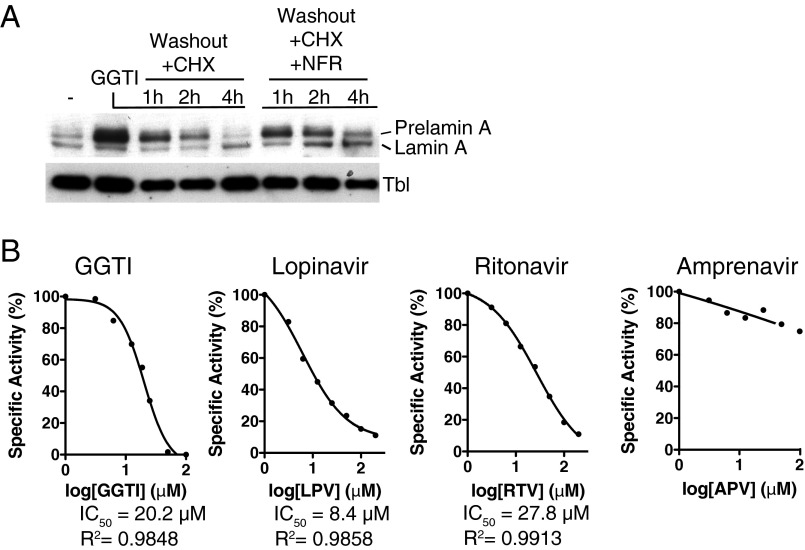
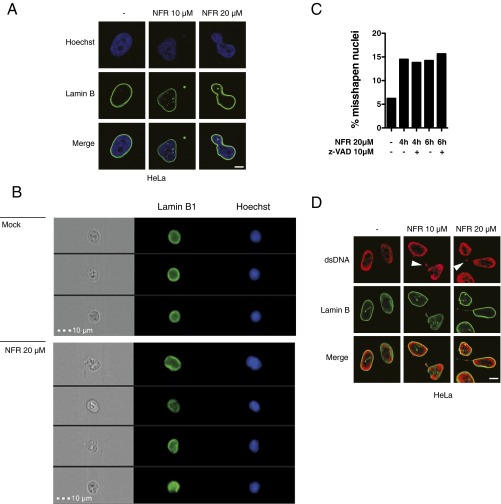
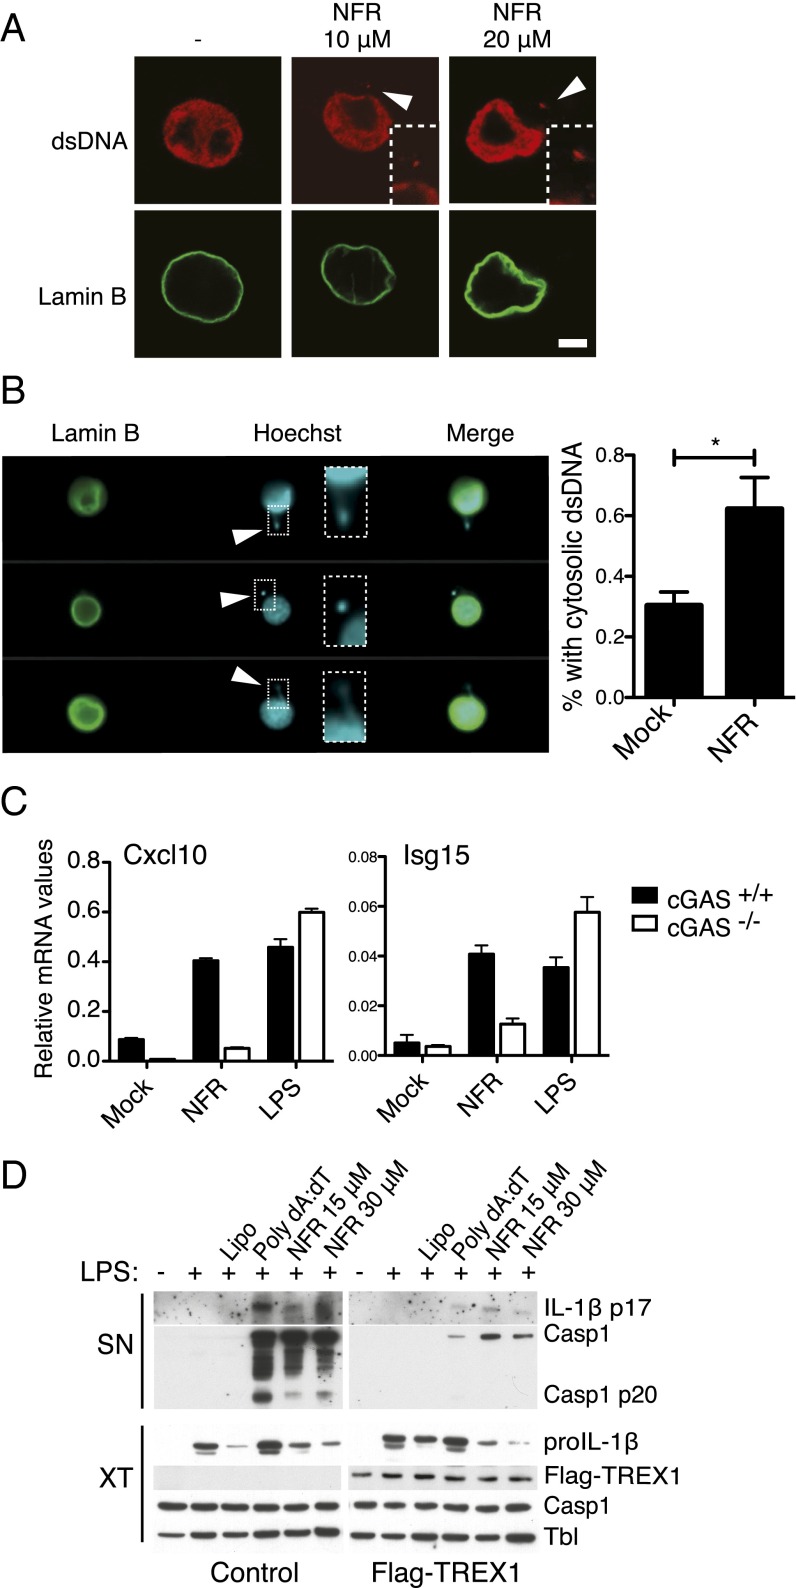
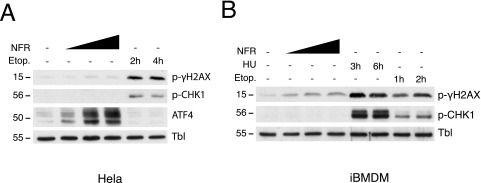
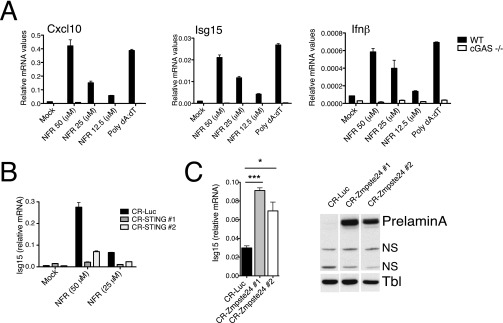
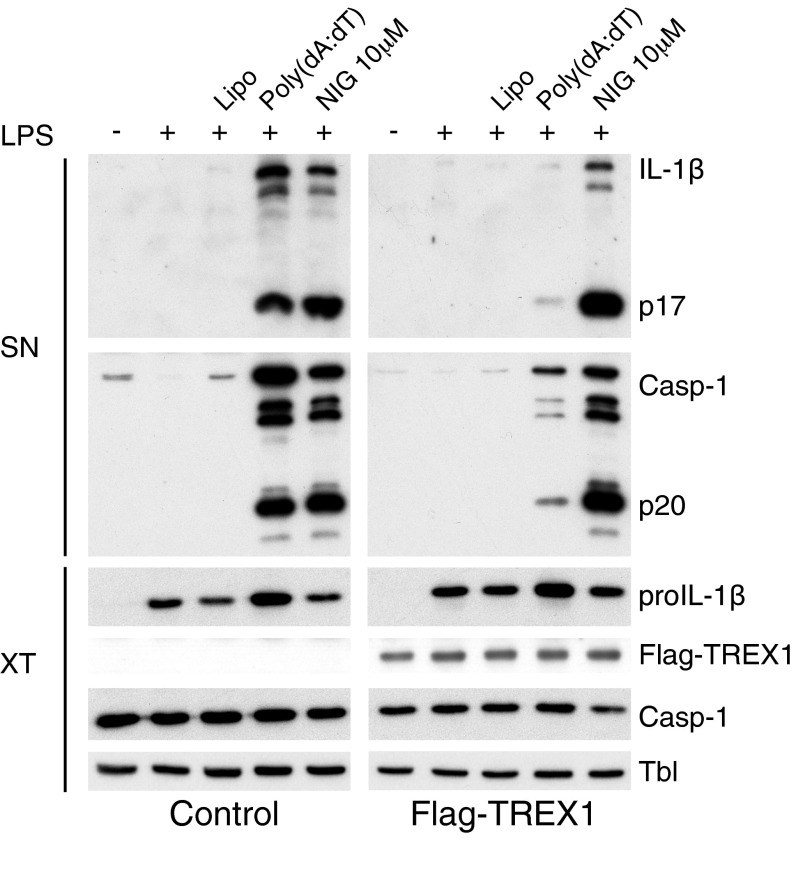
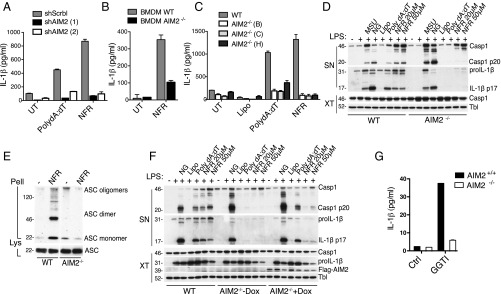
Inflammasomes are critical sensors that convey cellular stress and pathogen presence to the immune system by activating inflammatory caspases and cytokines such as IL-1β. The nature of endogenous stress signals that activate inflammasomes remains unclear. Here we show that an inhibitor of the HIV aspartyl protease, Nelfinavir, triggers inflammasome formation and elicits an IL-1R-dependent inflammation in mice. We found that Nelfinavir impaired the maturation of lamin A, a structural component of the nuclear envelope, thereby promoting the release of DNA in the cytosol. Moreover, deficiency of the cytosolic DNA-sensor AIM2 impaired Nelfinavir-mediated inflammasome activation. These findings identify a pharmacologic activator of inflammasome and demonstrate the role of AIM2 in detecting endogenous DNA release upon perturbation of nuclear envelope integrity.

Keywords: DNA sensors; Nelfinavir; inflammasome; nuclear envelope stress; zmpste24.


Conflict of interest statement

The authors declare no conflict of interest.

Figures

Fig. 1.
Fig. 1.
NFR triggers the release of active IL-1β. (A and B) Mice received intraperitoneally 0.2 mL of vehicle alone or supplemented with 100 mg/kg of NFR. Lavages were harvested after 5 h and analyzed for IL-1β by ELISA (A). IL-1R+/+ (WT) and IL-1R−/− were analyzed for neutrophil influx (CD11b+, LY6C+, LY6G+) by FACS (B). Data are pooled from two independent experiments and shown as means ± SEM *P < 0.05; **P < 0.01 (six to eight mice per group were analyzed). (C) LPS-primed BMDMs were treated with MSU (positive control) and NFR as indicated. IL-1β was monitored by ELISA at 6 h of treatment. Data are representative of at least three independent experiments. (D) PMA-differentiated THP-1 cells were stimulated with NFR for 6 h, and IL-1β release was tested by ELISA. Data are representative of three independent experiments.
Fig. 2.
Fig. 2.
Inflammatory caspases are required for IL-1β release and pyroptosis upon treatment with NFR. (AC) iBMDMs were primed with LPS and treated with 5 μM NG for 1 h or NFR for 6 h at the indicated concentrations. Caspase-1 expression and maturation was probed by immunoblot in supernatant (SN) or cell extracts (XT) (A); released IL-1β was measured by ELISA (B). The role of caspases was interrogated upon incubation with 20 μM NFR in the presence or absence of zVAD-fmk (C). Data are representative of at least three independent experiments. (D) Released IL-1β was measured by ELISA in LPS-primed caspase-1/11–deficient BMDMs or control cells (WT) treated for 6 h with Lipofectamine (Lipo), Lipo in combination with 1 μg/mL poly(dA:dT) [Poly(dA:dT)], or NFR as indicated. Data are representative of three independent experiments. (E) LDH release from LPS-primed caspase-1/11–deficient BMDMs or control cells (WT) treated for 1 h with 5 μM NG or 6 h with 50 μg/mL MSU, 1 μg/mL poly(dA:dT), or NFR as indicated. Data are representative of two independent experiments.
Fig. S1.
Fig. S1.
HIV-PIs activation of caspase-1. (A) LPS-primed BMDMs treated with NG and two concentrations (20 μM, 50 μM) of NFR or a panel of HIV-PIs was analyzed for caspase-1 and IL-1β maturation by immunoblotting. SN: supernatants; XT: cell extracts. Tubulin (Tbl) was used as a loading control. Data are representative of three independent experiments. (B) BMDMs were treated with NFR or increasing doses of the nonnucleoside reverse transcriptase inhibitor Efavirenz. IL-1β release was measured by ELISA. Data are representative of two independent experiments. (C) Immunoblot analysis of caspase-1 and IL-1β maturation in caspase-1/11–deficient BMDMs and control (WT) primed with LPS as indicated and treated with NG, Lipo, poly(dA:dT), or NFR.
Fig. 3.
Fig. 3.
NFR triggers the assembly of an ASC-dependent inflammasome. (A) BMDMs were primed with LPS and treated with NFR, poly(dA:dT), or NG as indicated. Cross-linked pellets (Pell) or soluble lysates (Lys) were immunoblotted for ASC or caspase-1. Data are representative of three independent experiments. (B) Immunofluorescence microscopy of BMDMs primed with LPS and treated with Lipo, Lipo in combination with 1 μg/mL poly(dA:dT) [Poly(dA:dT)], or NFR as indicated. DNA staining is shown in blue (Hoechst); ASC staining is shown in green. Arrowheads indicate ASC inflammasome specks. (Scale bar: 10 μm.) (C) ImageStream flow cytometric analysis of ASC inflammasomes. (Left) Representative images of LPS-primed BMDMs treated with vehicle (Mock) or NFR and stained with Hoechst in blue (DNA), lamin B1 in green (nucleus), and ASC in red. (Right) Quantification of ASC specks detected at 6 h upon treatment with poly(dA:dT) or NFR. Data are means ± SEM from three independent experiments analyzing at least 20,000 cells. *P < 0.05; ***P < 0.001. (D) Human THP-1 macrophages expressing a scrambled shRNA (shScrbl) or an shRNA directed against ASC (shASC) were differentiated and primed with PMA (0.5 μM) and treated with 5 μM NG for 30 min or NFR for 6 h as indicated. (Left) Immunoblot of cleaved IL-1β released in the supernatant (SN). Cell extracts were analyzed for ASC, caspase-1, and pro–IL-1β expression. (Right) Secreted IL-1β was measured by ELISA. (E) Immunoblot analysis of caspase-1 and IL-1β maturation in ASC-deficient and control (WT) BMDMs primed with LPS as indicated and treated with NG, MSU, Lipo, poly(dA:dT), and NFR. SN: supernatants; XT: cell extracts. Tubulin was used as a loading control. Data are representative of three independent experiments.
Fig. S2.
Fig. S2.
ASC is required for NFR-mediated maturation of IL-1β. ASC-deficient and control (WT) BMDMs primed with LPS as indicated were treated with NG, MSU, Lipo, poly(dA:dT), or NFR. IL-1β release was measured by ELISA. Data are representative of three independent experiments.
Fig. 4.
Fig. 4.
Inflammasome activation is NLRP3-independent. (A) Immunoblot analysis of caspase-1 and IL-1β maturation in NLRP3-deficient and control (WT) BMDMs primed with LPS as indicated and treated with NG for 30 min or with Lipo, poly(dA:dT), and NFR for 6 h. SN: supernatant; XT: cell extracts. Data are representative of at least three independent experiments. (B) LPS-primed iBMDMs were treated with Lipo, poly(dA:dT), or NFR for 6 h. These experiments were done in the absence or presence of 50 μM KCl or 20 μM of N-acetyl-cysteine (NAC). Caspase-1 activation and expression were measured by immunoblot of supernatant (SN) or cell extracts (XT), respectively. Data are representative of at least three independent experiments.
Fig. S3.
Fig. S3.
NFR does not affect mitochondrial membrane potential and drives a robust inflammasome response. (A) BMDMs primed with LPS and treated with NG, MSU, poly(dA:dT). ER-stress inducers: brefeldin A (BFA), thapsigargin (Tpg), tunicamycin (TM), and DTT. Protein translation inhibitors: cycloheximide (Cyclo), puromycin (Puro), or NFR. IL-1β release was measured by ELISA. UT, untreated. (B) The mitochondrial membrane potential was measured with JC-1 dye in BMDMs primed with LPS and treated with extracellular ATP, MSU, CCCP, or NFR. Data are representative of three independent experiments.
Fig. 5.
Fig. 5.
Nelfinavir impairs lamin-A maturation. (A) Quantitative proteomics using SILAC. Two populations of HeLa cells were fully labeled with either normal (light) or heavy isotopes and treated with NFR or vehicle, respectively, for 6 h. After lysis and protein quantitation, the two samples were mixed at a 1:1 ratio, followed by gradient SDS/PAGE and cutting of the gel into 48 slices. Each gel slice was then submitted to trypsin digestion and LC-MS/MS and relative quantitation of proteins in each slice. The profiles along the gel are then reconstructed for each protein together with their abundance and heavy-over-light (H/L) ratios. Proteins with lower apparent molecular weight bands reduced and higher apparent molecular weight increased in the presence of NFR were considered candidate protease substrates affected by NFR. m/z, mass-to-charge ratio. (B and C) HeLa cells were treated with increasing doses of NFR or the Zmpste24 inhibitor GGTI for 6 h (B) or with 10 μM of NFR for the indicated times (C). Cell lysates were analyzed for prelamin A accumulation by immunoblotting. Tubulin (Tbl) was used as a loading control. Data are representative of at least three independent experiments. Asterisk indicates a nonspecific signal. (D) Inhibition of ZMPSTE24 by NFR as measured by the endoprotease-coupled methylation assay described in Materials and Methods. The assay was performed on membrane preparations from ∆ste24rce1 yeast expressing human ZMPSTE24 using a synthetic farnesylated a-factor peptide as the substrate. The results are presented as percentage of the specific activity measured in presence of vehicle. Data are representative of three independent experiments. (E) Immunofluorescence microscopy of BMDMs treated 6 h with NFR or the Zmpste24 inhibitor GGTI as indicated. DNA staining is shown in blue (Hoechst); lamin B staining is shown in green. Representative images with misshapen nuclei are shown. (Scale bar: 10 μm.) (F) ImageStream flow cytometric analysis of nuclear shapes. Quantification of misshapen nuclei detected in BMDMs treated for 6 h with NFR or vehicle (Mock). Data are means ± SEM from three independent experiments analyzing at least 20,000 cells. *P < 0.05.
Fig. S4.
Fig. S4.
Virtual electropherogram with quantitative values produced by Slice-SILAC. Identified hits with at least one high MW slice with log2(H/L) ≥ 0.2 and one low MW slice with log2(H/L) ≤ −0.2 and at least three counts in both slices are shown; they have a pattern compatible with decreased processing in the presence of NFR. Bubble diameters are proportional to the number of quantified peptide matches, whereas the gradient color represents the H/L ratio, as indicated in at the right. The green bubbles (negative log2H/L) represent protein isoforms enriched in the NFR-treated sample; the red bubbles (positive log2H/L) represent protein isoforms reduced in the NFR-treated sample. Lamin A (LMNA) is highlighted in boldface type. The screen was performed once.
Fig. S5.
Fig. S5.
HIV-PIs that trigger AIM2 inflammasome inhibit ZMPSTE24. (A) HeLa cells were treated for 2 h with 10 μM GGTI before a cycloheximide (CHX) chase of accumulated prelamin A upon release of GGTI block. NFR or vehicle were added at the time of washout to measure its impact on prelamin A maturation. Tubulin (Tbl) is used as a loading control. Experiments are representative of two independent experiments. (B) Zmpste24 inhibition curves of inhibitors measured by the endoprotease-coupled methylation assay described in Materials and Methods. The assay was performed on membrane preparations from ∆ste24rce1 yeast expressing human ZMPSTE24 using a synthetic farnesylated a-factor peptide as the substrate. The results are presented as the percentage of the specific activity measured in the presence of vehicle. GGTI (inhibitor of Zmpste24, positive control), Lopinavir (LPV), Ritonavir (RTV), Amprenavir (APV). Data are representative of three independent experiments.
Fig. S6.
Fig. S6.
Nuclear alterations upon treatment with NFR. (A) Immunofluorescence microscopy of HeLa cells treated for 6 h with NFR. DNA staining is shown in blue (Hoechst), and lamin B staining is shown in green and shows altered nuclear shapes. Representative images with misshapen nuclei are shown. (Scale bar: 10 μm.) (B) ImageStream flow cytometric analysis of nuclei from BMDMs treated for 6 h with NFR or vehicle (Mock) as quantified in Fig. 5E. Representative cells with misshapen nuclei detected in the presence of NFR are shown. (C) ImageStream flow cytometric analysis of nuclear shapes. Quantification of misshapen nuclei detected in BMDMs treated for 6 h with NFR in the presence or absence of the caspase inhibitor z-VADfmk. Representative experiment of two analyzing at least 20,000 cells per sample. (D) Immunofluorescence microscopy of HeLa cells treated for 6 h with NFR. Staining for dsDNA (red) and lamin B (green) is shown. Representative images showing cytosolic dsDNA are shown. (Scale bar: 10 μm.)
Fig. 6.
Fig. 6.
Nelfinavir promotes the release of nuclear DNA. (A) Immunofluorescence microscopy of BMDMs treated for 6 h with NFR. Staining for dsDNA (red) and lamin B (green) is shown. Representative images with cytosolic dsDNA are shown. (Scale bar: 10 μm.) (B) ImageStream flow cytometric analysis of cytosolic DNA content. (Upper) Representative images of extra nuclear DNA detected in the cytosol of BMDMs treated for 6 h with NFR. (Lower) Quantification of cells with cytosolic DNA. Data are means ± SEM from three independent experiments analyzing at least 20,000 cells. *P < 0.05. (C) Relative mRNA levels measured by RT-qPCR of Cxcl10 and Isg15 in cGas+/+ and cGas−/− BMDMs stimulated for 15 h with 25 μM NFR or 500 ng/mL LPS. (D) iBMDMs stably overexpressing a Flag-tagged version of TREX1 or control population were primed with LPS as indicated and treated with Lipo, poly(dA:dT), and NFR. Caspase-1 and IL-1β maturation were analyzed by immunoblotting. Tubulin (Tbl) is used as a loading control. SN: supernatant; XT: cell extracts. Data are representative of two independent experiments.
Fig. S7.
Fig. S7.
NFR does not a trigger a DNA damage response. (A and B) HeLa cells (A) or iBMDMs (B) treated with NFR for 6 h or the DNA-damaging agents Etoposide (Etop.) or hydroxyurea (HU), as indicated, were analyzed for γH2AX, a biomarker for DNA double-strand breaks, and phosphorylated DNA-damage effector checkpoint kinase 1 (CHK1; p-Ser345). Tubulin is used as a loading control. ATF4 is a marker of NFR-mediated integrated stress response (ISR) activation. Tubulin (Tbl) is used as a loading control.
Fig. S8.
Fig. S8.
NFR activates cGAS-STING pathway. (A) mRNA levels of Ifnb and the IFN-responsive genes Cxcl10 and Isg15 measured by real-time qPCR in cGas+/+ or cGAS−/− MEFs stimulated for 15 h with the indicated doses of NFR or transfected with poly(dA:dT). Data are representative of three independent experiments. (B) mRNA levels of ISG15 in HeLa CRISPR-luciferase (control) or two CRISPR-STING KO clones stimulated for 6 h with the indicated doses of NFR. Data are representative of two independent experiments. (C) mRNA levels of ISG15 in HeLa CRISPR-luciferase (control) or two CRISPR-Zmpste24 KO clones. Data are means ± SEM from three experiments. *P < 0.05; ***P < 0.001. (Right) Representative immunoblots showing prelamin A accumulation in CRISPR-Zmpste24–deficient clones.
Fig. S9.
Fig. S9.
iBMDMs overexpressing Flag-TREX1 respond normally to NG. iBMDMs stably overexpressing a Flag-tagged version of TREX1 or control population were primed with LPS as indicated and treated with Lipo, poly(dA:dT), and NG. Caspase-1 and IL-1β maturation were analyzed by immunoblotting. SN: supernatant; XT: cell extracts. Tubulin (Tbl) was used as a loading control.
Fig. 7.
Fig. 7.
The DNA-sensor AIM2 mediates NFR and GGTI-driven inflammasome activation. (A) Human THP-1 macrophages expressing a scrambled shRNA (shScrbl) or two independent shRNA directed against AIM2 (shAIM2) were differentiated and primed with PMA (0.5 μM) and treated with poly(dA:dT) or NFR for 6 h as indicated. IL-1β release was measured by ELISA. (B) LPS-primed BMDMs isolated from AIM2-deficient animals (AIM2−/−) or controls (WT) were treated with 20 μM NFR. IL-1β release was measured by ELISA. (C) WT iBMDMs and three clones isolated from AIM2-deficient animals (clones B, C, and H) were primed with LPS and treated with Lipo, poly(dA:dT), or 20 μM NFR for 6 h as indicated. IL-1β release was measured by ELISA. (D) Immunoblot analysis of caspase-1 and IL-1β maturation in AIM2-deficient and control (WT) BMDMs primed with LPS as indicated and treated with NG, MSU, Lipo, poly(dA:dT), and NFR. SN: supernatants; XT: cell extracts. Tubulin (Tbl) is used as a loading control. (E) iBMDMs from WT or AIM2-deficient mice were primed with LPS and treated with 20 μM NFR. Cross-linked pellets (Pell) or soluble lysates (Lys) were immunoblotted for ASC. (F) Immunoblot analysis of caspase-1 and IL-1β maturation in AIM2-deficient iBMDMs reconstituted with an inducible Flag-tagged AIM2 protein and control (WT) primed with LPS as indicated and treated with NG, Lipo, poly(dA:dT), or NFR. Doxycycline (Dox) was used to induce the AIM2 expression. SN: supernatants; XT: cell extracts. Tbl was used as a loading control. (G) LPS-primed iBMDMs from AIM2-deficient animals (AIM2−/−) or controls (WT) were treated with 10 μM of the Zmpste24 inhibitor GGTI, and IL-1β release was measured by ELISA. Data in AG are representative of at least three independent experiments.

Similar articles

Cited by

References

    1. Wen H, Miao EA, Ting JP. Mechanisms of NOD-like receptor-associated inflammasome activation. Immunity. 2013;39(3):432–441. - PMC - PubMed
    1. Man SM, Kanneganti TD. Converging roles of caspases in inflammasome activation, cell death and innate immunity. Nat Rev Immunol. 2016;16(1):7–21. - PMC - PubMed
    1. Martinon F, Burns K, Tschopp J. The inflammasome: A molecular platform triggering activation of inflammatory caspases and processing of proIL-beta. Mol Cell. 2002;10(2):417–426. - PubMed
    1. Guo H, Callaway JB, Ting JP. Inflammasomes: Mechanism of action, role in disease, and therapeutics. Nat Med. 2015;21(7):677–687. - PMC - PubMed
    1. Lamkanfi M, Dixit VM. Mechanisms and functions of inflammasomes. Cell. 2014;157(5):1013–1022. - PubMed

Publication types

MeSH terms