. 2016 Aug 9;113(32):E4662-70.
doi: 10.1073/pnas.1605849113. Epub 2016 Jul 26.

Peripheral tolerance can be modified by altering KLF2-regulated Treg migration

Affiliations

Peripheral tolerance can be modified by altering KLF2-regulated Treg migration

Sudheer K Pabbisetty et al. Proc Natl Acad Sci U S A. .

Abstract

Tregs are essential for maintaining peripheral tolerance, and thus targeting these cells may aid in the treatment of autoimmunity and cancer by enhancing or reducing suppressive functions, respectively. Before these cells can be harnessed for therapeutic purposes, it is necessary to understand how they maintain tolerance under physiologically relevant conditions. We now report that transcription factor Kruppel-like factor 2 (KLF2) controls naive Treg migration patterns via regulation of homeostatic and inflammatory homing receptors, and that in its absence KLF2-deficient Tregs are unable to migrate efficiently to secondary lymphoid organs (SLOs). Diminished Treg trafficking to SLOs is sufficient to initiate autoimmunity, indicating that SLOs are a primary site for maintaining peripheral tolerance under homeostatic conditions. Disease severity correlates with impaired Treg recruitment to SLOs and, conversely, promotion of Tregs into these tissues can ameliorate autoimmunity. Moreover, stabilizing KLF2 expression within the Treg compartment enhances peripheral tolerance by diverting these suppressive cells from tertiary tissues into SLOs. Taken together, these results demonstrate that peripheral tolerance is enhanced or diminished through modulation of Treg trafficking to SLOs, a process that can be controlled by adjusting KLF2 protein levels.

Keywords: KLF2; Treg migration; autoimmunity; peripheral tolerance; regulatory T cell.


Conflict of interest statement

The authors declare no conflict of interest.

Figures
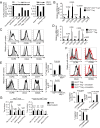
Fig. 1.
Fig. 1.
KLF2 levels determine homeostatic and inflammatory homing receptor expression patterns on Tregs. (A) Immunoblot and densitometry reading of KLF2 and tubulin using total cell lysate from conventional T cells (CD4+CD25), activated T cells (αCD3/CD28), and Tregs (CD4+CD25+) cultured for 12 h in medium supplemented with the indicated inhibitors. Alternatively, KLF2 and tubulin were measured using cell lysate from naive T cells (CD4+CD25CD62L+CD44), Tregs (CD4+CD25+), and memory T cells (CD4+CD25CD62LCD44+). This experiment was repeated twice. (B) Transcriptional levels of Klf2 and select homing receptors expressed on KLF2-sufficient CD4+ T cells versus KLF2-sufficient Tregs as determined by RT-PCR. This experiment was performed three times in triplicate. Error bars indicate SD. When significant, P values (Student’s t test) are shown. (C) Cell-surface expression of select homing receptors on KLF2-sufficient CD4+CD25 T cells (gray histogram) versus KLF2-sufficient CD4+CD25+FoxP3+ Tregs (open histogram) as determined by flow cytometry. n = 4 experiments. (D) Transcriptional levels of Klf2 and select homing receptors expressed on Tregs harvested from Klf2fl/fl (black bars) or from Foxp3-cre; Klf2fl/fl (gray bars) littermates as determined by RT-PCR. n = 3 experiments performed in triplicate. P values (Student’s t test) are shown; error bars indicate SD. (E) Flow cytometric analysis of homing receptors expressed on the surface of Tregs harvested from Klf2fl/fl (gray histogram) or Foxp3-cre; Klf2fl/fl (open histogram) animals. n = 4 experiments. Alternatively, ex vivo Treg migration was measured using CCL25 or S1P as chemotactic ligands for CCR9 and S1P1, respectively. n = 2 experiments performed in triplicate. P values (Student’s t test) are shown; error bars indicate SD. (F) Histogram overlays of homing receptors expressed on the surface of KLF2-sufficient Tregs treated with simvastatin or medium alone or KLF2-deficient Tregs treated with simvastatin. n = 3 experiments. Alternatively, KLF2-sufficient Tregs treated with simvastatin or medium alone were used to measure ex vivo migration toward CCL19 (CCR7 ligand), S1P (S1P1 ligand), or CCL25 (CCR9 ligand). n = 2 experiments performed in triplicate, except CCL19 which was performed three times. P values (Student’s t test) are shown; error bars indicate SD. (G) Tissue-specific Treg numbers in Klf2fl/fl (Left) versus Foxp3-cre; Klf2fl/fl (Right) mice following 72-h treatment with simvastatin (20 mg/kg, open bars) or vehicle control (black bars). n = 2 experiments performed in triplicate. P values (Student’s t test) are shown; error bars indicate SD.
Fig. 2.
Fig. 2.
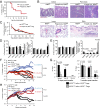
Inefficient Treg trafficking to SLOs is sufficient to cause autoimmunity. (A) Kaplan–Meier curve documenting disease incidence in Lck-cre; Klf2fl/fl (black line, n = 30 mice) versus Foxp3-cre; Klf2fl/fl (red line, n = 30 mice) animals. Visible signs of disease included cachexia, hair loss and irritated skin, inflamed eyelids, damaged ears or tail, and hind limb paralysis. (B) Histopathology of tissues harvested from Foxp3-cre; Klf2fl/fl and littermate control Klf2fl/fl mice at 4 mo of age. Foxp3-cre; Klf2fl/fl mice were visibly ill when they were killed. n = 2 mice per group. (Magnification: 20× for skin; 40× for remaining tissues.) (C) Suppression of T-cell proliferation using Tregs harvested from Klf2fl/fl and from visibly sick Foxp3-cre; Klf2fl/fl mice. This experiment was performed twice. Error bars indicate SD. No significant differences were found, as determined by ANOVA. (D) Recovery of CD4+ T cells cotransferred from Klf2fl/fl (black bar) and Lck-cre; Klf2fl/fl (gray bar) mice into CD90.1+ recipient animals. n = 4 recipients. (Left) Ratio of KLF2-sufficient versus KLF2-deficient CD4+ T cells recovered in various tissues. (Right) Frequency of Tregs relative to CD4+ T cells found in specified tissues. Ax LN, axillary lymph nodes; Ms LN, mesenteric lymph nodes. *P < 0.005; **P < 0.001. n = 2 experiments; error bars indicate SD. (E) As in D, except cotransferred CD4+ T cells were derived from Klf2fl/fl (black bar) and Foxp3-cre; Klf2fl/fl (gray bar) mice. (Left) P > 0.05 for each tissue. (Right) P values are shown; error bars indicate SD. (F) A mouse model of colitis using KLF2-sufficient effector T cells transferred into lymphopenic recipients. Effector T cells from Klf2fl/fl mice were transferred into scid animals alone (black lines) or in combination with Tregs from Klf2fl/fl (blue lines) or from Foxp3-cre; Klf2fl/fl (red lines) mice. Average weight of each cohort at 3 mo is shown along with statistical differences between groups. This experiment was repeated three times; n = 4 recipients per cohort. (G) Frequency of recovered Tregs following the cotransfer of wild-type effector T cells + wild-type Tregs (black bars) or KLF2-deficient Tregs (gray bars) into scid recipients. Animals were killed 3 d (Left) or 3 mo (Right) posttransfer. P values (Student’s t test) are shown; error bars indicate SD. This experiment was performed twice, with four recipients per cohort. (H) As in F, except effector T cells were derived from Lck-cre; Klf2fl/fl animals. Scid mice received effector T cells alone (black lines) or in combination with Tregs harvested from Lck-cre; Klf2fl/fl (red lines) or Klf2fl/fl (blue lines) animals. This experiment was repeated three times; n = 3 mice per cohort.
Fig. 3.
Fig. 3.
KLF2 regulates Treg entry and placement within SLOs. (A) Frequency of Tregs relative to CD4+ T cells in Klf2fl/fl, Lck-cre; Klf2fl/fl, and Foxp3-cre; Klf2fl/fl mice. n = 8 mice per group. No significant (P > 0.05) differences were detected between cohorts (ANOVA). (B) Immunohistochemistry of spleen (Top and Middle) and mesenteric lymph nodes (Bottom) from a recipient wild-type mouse following the cotransfer (1:1) of KLF2-sufficient (red) or KLF2-deficient (green) Tregs derived from Klf2fl/fl and Foxp3-cre; Klf2fl/fl mice, respectively. Treg localization is shown relative to MOMA1+ metallophilic macrophages that envelop the splenic white pulp and/or CD3+ T-cell–rich and B220+ B-cell–rich areas of SLOs. Arrowheads and asterisks highlight KLF2-deficient and KLF2-sufficient Tregs, respectively. n = 3 experiments. (C) Number and frequency of KLF2-sufficient versus KLF2-deficient Tregs in defined SLO compartments following adoptive transfer, as described in B. Transferred Tregs in spleen, white pulp, splenic T-cell area, and mesenteric lymph nodes (Ms LN) and the associated T-cell area were quantified from 25, 20, 15, 16, and 16 individual field of views (magnification: 10×), respectively. Significance was determined using paired Student’s t test. (D) Immunohistochemistry of transferred Tregs (as in B) relative to CD11c+ cells in the spleen. (Right) Average number of Treg–CD11c+ interactions observed per field of view at 20× magnification (25 fields). (E) Flow cytometric analysis of Treg–CD11c+ conjugate formation 16 h after cotransfer of KLF2+ (Klf2fl/fl) and KLF2-deficient (Foxp3-cre; Klf2fl/fl) Tregs. (Left) CD11c expression associated with Tregs before transfer (solid histogram) and with transferred Tregs (open histograms). (Right) Frequency of CD11c+ cells associated with transferred Tregs. n = 2 experiments performed in triplicate. Significance was determined using paired Student’s t test.
Fig. S1.
Fig. S1.
Immunohistochemistry of spleen and mesenteric lymph nodes from Klf2fl/fl, Lck-cre; Klf2fl/fl, and Foxp3-cre; Klf2fl/fl mice. (A) T-cell (anti-CD3ε) versus Treg (anti-Foxp3) staining on adjacent serial tissue sections. n = 7 mice per group. (Magnification: 10×.) (B) Costaining for Foxp3 (brown) and CD11c (red) on splenic tissue from Klf2fl/fl and Foxp3-cre; Klf2fl/fl mice. (Magnification: 15×.) CD11c-enriched (red box) and CD11c-sparce (black box) areas are enlarged on the right. (C) Quantitation of Treg–dendritic cell (DC) conjugates (magnification: 32×), as determined by the number of Foxp3+ cells seen overlapping with CD11c+ tissue. (Left) Average number of Treg–dendritic cell interactions per high-powered field. (Right) Frequency of Treg–dendritic cell interactions relative to total number of Tregs observed per high-powered field. P > 0.05 as determined by Student’s t test; error bars indicate SD. n = 10 hpf per mouse spleen, four Klf2fl/fl and three Foxp3-cre; Klf2fl/fl mice examined.
Fig. 4.
Fig. 4.
The degree of peripheral tolerance correlates with Treg migration to SLOs. (A) Kaplan–Meier survival curves of CCR7−/− (black line, n = 10), CCR7−/−; Foxp3-cre; Klf2fl/fl (red line, n = 10), and CCR7−/−; Lck-cre; Klf2fl/fl (blue line, n = 7) mice. (B) Histogram overlays of CD25 surface expression on CD4+FoxP3 T cells (Left) and CD8+ T cells (Right) harvested from CCR7−/− (gray line), Lck-cre; Klf2fl/fl (black line), or CCR7−/−; Lck-cre; Klf2fl/fl (red line) mice. Corresponding mean fluorescent intensity is displayed in each quadrant. n = 3 experiments. (C) Percentage of Tregs (CD25+FoxP3+) relative to CD4+ T cells recovered from wild-type (C57BL/6), CCR7−/−, CCR7−/−; Lck-cre; Klf2fl/fl, and CCR7−/−; Foxp3-cre; Klf2fl/fl mice. Contour plots are representative of four mice per cohort. (D) Quantification of adoptively transferred KLF2-deficient Tregs in wild-type recipients. Tregs from Foxp3-cre; Klf2fl/fl animals were transduced with MigR1-CCR7 (or control vector), and their tissue localization was analyzed 16 h posttransfer. This experiment was performed once in quadruplicate. (E) Colitis mouse model using KLF2-sufficient effector T cells transferred into lymphopenic recipients. Effector T cells from Klf2fl/fl animals were cotransferred into scid mice along with Tregs from Foxp3-cre; Klf2fl/fl (red line) or Klf2fl/fl (blue line) animals. Alternatively, Tregs from Foxp3-cre; Klf2fl/fl mice were transduced with a CCR7 expression vector before cotransfer with KLF2-sufficient effector T cells (black line). Average change in weight is charted over time. This experiment was performed twice; n = 5 mice per cohort. P values are shown; error bars indicate SD.
Fig. 5.
Fig. 5.
Peripheral tolerance is reestablished by enhancing KLF2 expression within the Treg compartment. (AC) aGVHD in H2d mice that received H2b T cells + transduced H2b CD62Llow Tregs. This experiment was performed twice; n = 5 mice per cohort. (A) Average changes in weight over time were graphed for mice that received Tregs transduced with empty vector (black line) or a nondegradative form of KLF2 [KLF2(ND)] (red line). P value was determined by Mann–Whitney test; error bars indicate SD. (B) Histology (H&E staining) of colon (Upper) and small intestine (Lower) from mice that received Tregs transduced with empty vector or a nondegradative form of KLF2. (Magnification: 20×.) (C) Pathologic scores of colon (Left) and small intestine (Right) from mice receiving control Tregs or KLF2(ND)-transduced Tregs. P values (Student’s t test) are displayed. (DG) aGVHD in H2d mice that received H2b T cells ± cultured CD62Llow Tregs. This experiment was performed twice; n = 5 mice per cohort. (D) Average changes in weight over time were graphed for mice that received no Tregs (gray line) or Tregs that were treated with simvastatin (red line) or vehicle control (black line). P values (Student’s t test) at termination are shown; error bars indicate SD. (E) Histology of colon from mice that received Tregs that were treated with simvastatin or vehicle control. (Magnification: 20×.) (F) Pathologic scores of colon from mice that received effector T cells ± Tregs treated with simvastatin or vehicle control. P values (Student’s t test) are shown. (G) Histogram overlays of CD25 (Left) and CD44 (Right) surface expression on CD4+Foxp3 T cells harvested from the spleen and mesenteric lymph nodes of mice that received effector T cells alone (gray) or in combination with Tregs that were treated with simvastatin (red line) or vehicle control (black line). Corresponding average mean fluorescent intensity (± SD) and P values (ANOVA) are shown below the histograms.

References

    1. Josefowicz SZ, Lu LF, Rudensky AY. Regulatory T cells: Mechanisms of differentiation and function. Annu Rev Immunol. 2012;30:531–564. - PMC - PubMed
    1. Sakaguchi S, Miyara M, Costantino CM, Hafler DA. FOXP3+ regulatory T cells in the human immune system. Nat Rev Immunol. 2010;10(7):490–500. - PubMed
    1. Bates GJ, et al. Quantification of regulatory T cells enables the identification of high-risk breast cancer patients and those at risk of late relapse. J Clin Oncol. 2006;24(34):5373–5380. - PubMed
    1. Curiel TJ, et al. Specific recruitment of regulatory T cells in ovarian carcinoma fosters immune privilege and predicts reduced survival. Nat Med. 2004;10(9):942–949. - PubMed
    1. Fu J, et al. Increased regulatory T cells correlate with CD8 T-cell impairment and poor survival in hepatocellular carcinoma patients. Gastroenterology. 2007;132(7):2328–2339. - PubMed

Substances

LinkOut - more resources