

Comment
doi: 10.1093/toxsci/kfw113.
From the Editor's Desk, Editor's Highlights, Letters to the Editor
- PMID: 27462124
- PMCID: PMC4960913
- DOI: 10.1093/toxsci/kfw113
Item in Clipboard
Comment
From the Editor's Desk, Editor's Highlights, Letters to the Editor
Toxicol Sci.
2016 Aug.
No abstract available
Figures

(A) Diagram of a sagittal section at lateral ∼1.90 mm with the approximate location of the displayed XRF scan indicated by the cyan box. (B) Summary of Cu concentrations in the SVZ and RMS for control (white) and treated (gray) groups (mean ± standard deviation). Concentrations are shown for both the whole ROI (left) and thresholded regions (right). * P < 0.05 for treated versus control. Line: 8.5 μg/g threshold. n = 5 rats per group. (C) Typical Cu XRF image with different brain regions labeled; the scale bar for Cu concentrations is given in μg/g. Example of SVZ and RMS selection prior to widening (D) and after widening by ±3 pixels in the 4 cardinal directions (E). Note that widening overestimates the spatial dimensions of both the RMS and SVZ, thereby including neighboring structures (i.e. STR, CC, and/or LV), while removing the selection bias of the experimenter. (F) Results after applying a concentration threshold of 8.5 μg/g. Given numbers are in μg/g. Abbreviations: Ctx, cortex; CC, corpus callosum; LV, lateral ventricle; RMS, rostral migratory stream; STR, straitum; SVZ, subventricular zone. Scale bar: 1 mm.
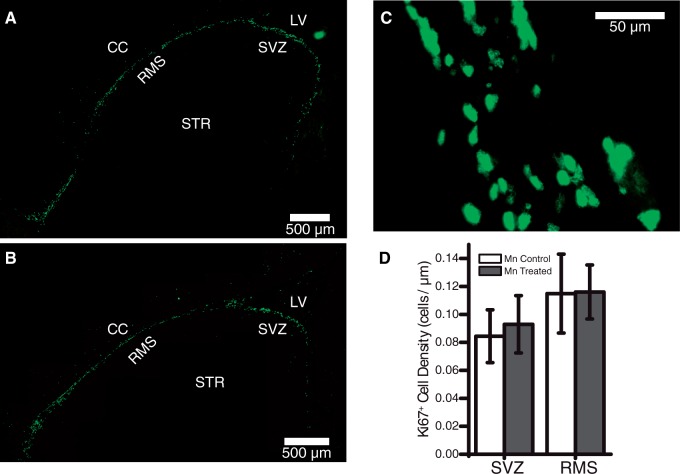
(A) Representative Ki67 stain of the SVZ and RMS for a control rat and (B) representative Ki67 stain for a Mn-treated rat. Magnification 10×. (C) High magnification (40×) view of the RMS in a control rodent. (D) Quantitation of neurogenesis (mean ± standard deviation) by Ki67+ cell density in the SVZ and RMS.
Comment on
-
Elevated adult neurogenesis in brain subventricular zone following in vivo manganese exposure: roles of copper and DMT1.Toxicol Sci. 2015 Feb;143(2):482-98. doi: 10.1093/toxsci/kfu249. Epub 2015 Jan 8. Toxicol Sci. 2015. PMID: 25575534 Free PMC article.
Publication types
Grants and funding
LinkOut - more resources
Full Text Sources
Other Literature Sources
