. 2016 Jul 12:7:990.
doi: 10.3389/fpls.2016.00990. eCollection 2016.

Response of Soil Properties and Microbial Communities to Agriculture: Implications for Primary Productivity and Soil Health Indicators

Affiliations

Response of Soil Properties and Microbial Communities to Agriculture: Implications for Primary Productivity and Soil Health Indicators

Pankaj Trivedi et al. Front Plant Sci. .

Abstract

Agricultural intensification is placing tremendous pressure on the soil's capacity to maintain its functions leading to large-scale ecosystem degradation and loss of productivity in the long term. Therefore, there is an urgent need to find early indicators of soil health degradation in response to agricultural management. In recent years, major advances in soil meta-genomic and spatial studies on microbial communities and community-level molecular characteristics can now be exploited as 'biomarker' indicators of ecosystem processes for monitoring and managing sustainable soil health under global change. However, a continental scale, cross biome approach assessing soil microbial communities and their functional potential to identify the unifying principles governing the susceptibility of soil biodiversity to land conversion is lacking. We conducted a meta-analysis from a dataset generated from 102 peer-reviewed publications as well as unpublished data to explore how properties directly linked to soil nutritional health (total C and N; C:N ratio), primary productivity (NPP) and microbial diversity and composition (relative abundance of major bacterial phyla determined by next generation sequencing techniques) are affected in response to agricultural management across the main biomes of Earth (arid, continental, temperate and tropical). In our analysis, we found strong statistical trends in the relative abundance of several bacterial phyla in agricultural (e.g., Actinobacteria and Chloroflexi) and natural (Acidobacteria, Proteobacteria, and Cyanobacteria) systems across all regions and these trends correlated well with many soil properties. However, main effects of agriculture on soil properties and productivity were biome-dependent. Our meta-analysis provides evidence on the predictable nature of the microbial community responses to vegetation type. This knowledge can be exploited in future for developing a new set of indicators for primary productivity and soil health.

Keywords: agriculture intensification; indicators; soil bacteria; soil health.


Figures

FIGURE 1
FIGURE 1
Locations of the soil samples included in this study. Agricultural soil samples (n = 165) and natural soil samples (n = 353) are shown as circles and squares, respectively. The sites were selected based on a meta-analysis consisting of both published and unpublished data wherein bacterial diversity and compositions is described based on next generation sequencing techniques (either 454 or Miseq) from both. From those experimental studies that manipulated environmental conditions (e.g., nutrients or climatic conditions) we only used the data from the control treatment (See Material and Methods for more details).
FIGURE 2
FIGURE 2
Net primary productivity (measured as g C m2 d-1) of agricultural vs. natural systems in arid (n = 26 and 70), continental (n = 43 and 119), temperate (n = 82 and 128) and tropical (n = 14 and 36) regions. Data for primary productivity (g C m-2 d-1) was calculated from MODIS satellite imagery data as a monthly average from the 2004–2013 period using information with a 0.1° spatial resolution (http://neo.sci.gsfc.nasa.gov/). The main climate classes are based on global maps available for the most frequently used Köppen climate classification map (Kottek et al., 2006). ***P < 0.0001.
FIGURE 3
FIGURE 3
Soil chemical properties [(A) Soil pH; (B) Soil total C (%); (C) Soil total N (%); and (D) C/N ratio] of agricultural vs. natural systems in arid (n = 26 and 70), continental (n = 43 and 119), temperate (n = 82 and 128) and tropical (n = 14 and 36) regions. The sites were selected based on a meta-analysis consisting of both published and unpublished data wherein bacterial diversity and compositions is described based on next generation sequencing techniques (either 454 or Miseq; see Material and Methods for more details). The main climate classes are based on global maps available for the most frequently used Köppen climate classification map (Kottek et al., 2006). *P < 0.01; **P < 0.001; ***P < 0.0001.
FIGURE 4
FIGURE 4
Bacterial Shannon diversity of agricultural vs. natural systems in arid (n = 26 and 70), continental (n = 43 and 119), temperate (n = 82 and 128) and tropical (n = 14 and 36) regions. The sites were selected based on a meta-analysis consisting of both published and unpublished data wherein bacterial diversity and compositions is described based on next generation sequencing techniques (either 454 or Miseq; see Material and Methods for more details). The main climate classes are based on global maps available for the most frequently used Köppen climate classification map (Kottek et al., 2006). *P < 0.01; **P < 0.001.
FIGURE 5
FIGURE 5
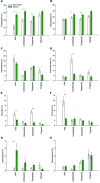
Relative abundance of major bacterial phylum [(A) Acidobacteria; (B) Proteobacteria; (C) Actinobacteria; (D) Verrucomicrobia; (E) Chloroflexi; (F) Firmicutes; (G) Cyanobacteria; and (H) Planctomycetes] in agricultural vs. natural systems in different regions. The sites were selected based on a meta-analysis consisting of both published and unpublished data wherein bacterial diversity and compositions is described based on next generation sequencing techniques (either 454 or Miseq; see Material and Methods for more details). The main climate classes are based on global maps available for the most frequently used Köppen climate classification map (Kottek et al., 2006). *P < 0.01; **P < 0.001; ***P < 0.0001.

References

    1. Acosta-Martinez V., Burow G., Zobeck T. M., Allen V. G. (2010). Soil microbial communities and function in alternative systems to continuous cotton. Soil Sci. Soc. Am. J. 74 1181–1192. 10.2136/sssaj2008.0065 - DOI
    1. Acosta-Martinez V., Dowd S., Sun Y., Allen V. (2008). Tag-encoded pyrosequencing analysis of bacterial diversity in a single soil type as affected by management and land use. Soil Biol. Biochem. 40 2762–2770. 10.1016/j.soilbio.2008.07.022 - DOI
    1. Armstrong R. D., Eagle C., Flood R. (2015). Improving grain yields on a sodic clay soil in a temperate, medium-rainfall cropping environment. Crop Pasture Sci. 66 492–505. 10.1071/CP14210 - DOI
    1. Bala G., Caldeira K., Wickett M., Phillips T. J., Lobell D. B., Delire C., et al. (2007). Combined climate and carbon-cycle effects of large-scale deforestation. Proc. Nat. Acad. Sci. U.S.A. 104 6550–6555. 10.1073/pnas.0608998104 - DOI - PMC - PubMed
    1. Balmford A., Bennun L., Brink B. T., Cooper D., Cote I. M., Crane P., et al. (2005). The convention on biological diversity’s 2010 target. Science 307 212–213. 10.1126/science.1106281 - DOI - PubMed

LinkOut - more resources