. 2016 Jul 12:7:1010.
doi: 10.3389/fpls.2016.01010. eCollection 2016.

Genome Wide Association Mapping in Arabidopsis thaliana Identifies Novel Genes Involved in Linking Allyl Glucosinolate to Altered Biomass and Defense

Affiliations

Genome Wide Association Mapping in Arabidopsis thaliana Identifies Novel Genes Involved in Linking Allyl Glucosinolate to Altered Biomass and Defense

Marta Francisco et al. Front Plant Sci. .

Abstract

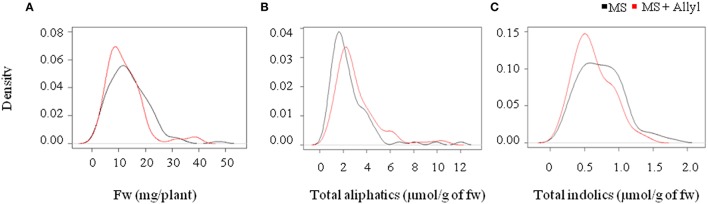
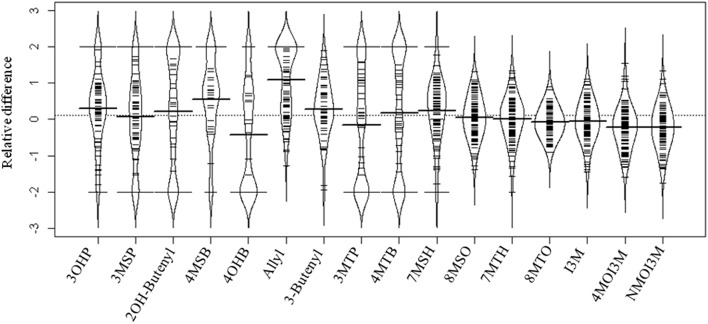
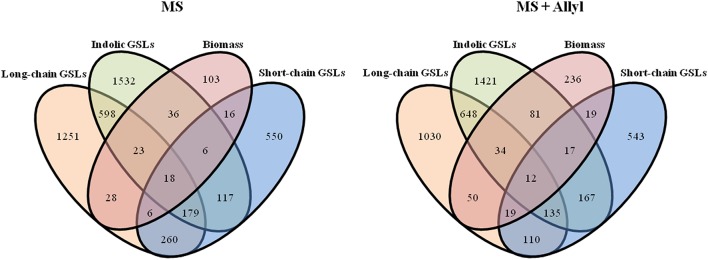
A key limitation in modern biology is the ability to rapidly identify genes underlying newly identified complex phenotypes. Genome wide association studies (GWAS) have become an increasingly important approach for dissecting natural variation by associating phenotypes with genotypes at a genome wide level. Recent work is showing that the Arabidopsis thaliana defense metabolite, allyl glucosinolate (GSL), may provide direct feedback regulation, linking defense metabolism outputs to the growth, and defense responses of the plant. However, there is still a need to identify genes that underlie this process. To start developing a deeper understanding of the mechanism(s) that modulate the ability of exogenous allyl GSL to alter growth and defense, we measured changes in plant biomass and defense metabolites in a collection of natural 96 A. thaliana accessions fed with 50 μM of allyl GSL. Exogenous allyl GSL was introduced exclusively to the roots and the compound transported to the leaf leading to a wide range of heritable effects upon plant biomass and endogenous GSL accumulation. Using natural variation we conducted GWAS to identify a number of new genes which potentially control allyl responses in various plant processes. This is one of the first instances in which this approach has been successfully utilized to begin dissecting a novel phenotype to the underlying molecular/polygenic basis.

Keywords: Arabidopsis; GWAS; allyl GSL; defense metabolism; novel genes; plant biomass.


Figures

Figure 1
Figure 1
Natural variation in Arabidopsis biomass and GSL accumulation in response to exogenous allyl GSL. (A) Kernel density plots showing the distribution of fw (mg/plant), (B) total aliphatic GSLs, and (C) total indolic GSLs (μmol/g of fw) from 96 natural Arabidopsis accessions grown in MS (black line) and MS + Allyl (red line).
Figure 2
Figure 2
Distribution of the relative difference of individual GSL accumulation in response to allyl GSL treatment across the Arabidopsis accessions. A beanplot is used to show the distribution of the change in GSL accumulation between the treated and untreated samples across the accessions using the abbreviations in Table S1. Relative difference was determined as (GSL treatment − GSL control)/(0.5 × [GSL treatment + GSL control]). The dashed line in the middle of the plot is the overall average of the relative GSL difference between control and allyl treatment across all GSL. The thick black line in the middle of each bean for each compound is the mean response for that specific GSL trait across all the accessions. The black colored curved bean pod surrounding the observations is the theoretical probability density distribution of these observations. The small lines represent individual data points, with the length of the line proportional to the number of observations with that specific value. The relative difference between treatment and control varied across the 96 accessions from −2 to 2 for each GSL compound, depending on whether that GSL was present in the treatment compared with control.
Figure 3
Figure 3
Manhattan plots of GWAS results. Genome wide distribution of the absolute value of the heteroscedastic SNP effects. Shades of gray represent nonsignificant SNP effects. Blue points represent significant SNP effects under control (MS) and allyl treatment (MS + Allyl). (A) Plant Biomass, (B) Short-Chain GSLs, (C) Long-Chain GSLs, (D) Aliphatic GSLs, (E) Indolic GSLs.
Figure 4
Figure 4
Overlap of significant GWA candidate genes between control (MS) and treated samples with 50 μM of allyl GSL (MS + Allyl GSL). VENN diagram showing common candidate genes identified among the plant biomass, short-chain GSLs, long-chain GSLs, total aliphatic GSLs, total incolic GSLs, and total GSLs traits.
Figure 5
Figure 5
Overlap of significant GWA candidate genes between plant biomass and GSL phenotypes. VENN diagram showing common candidate genes identified among the short-chain GSLs, long-chain GSLs, total incolic GSLs and plant biomass traits studied from control (MS) and treated samples with 50 μM of allyl GSL (MS + Allyl).
Figure 6
Figure 6
Plant biomass responses and GSL content variation among T-DNA insertion lines of 13 candidate genes treated with allyl GSL. (A) Quantification of 15-day-old fw (mg/plant) seedlings from T-DNA insertion lines of 13 candidate genes and wild-type (Col-0) fed with 50 μM of allyl glucosinolate. (B) Ratio of 4-methylsulfinylbutyl (4MSB)/4-methylthiobutyl (4MTB) calculated as 4MSB/(4MSB + 4MTB). (C) Average allyl GSL accumulation of the evaluated genotypes. The bar chart represents the mean and the standard deviation. Each genotype within each treatment has a minimum of 40 independent measurements conducted across four experiments using a randomized block design. Means with the same letter show if the genotype's response to the treatment was statistically similar to Col-0 (a) or different from Col-0 (b) at P ≤ 0.05 from the two-way ANOVA analysis (Table S5). Gene's in bold have one or more phenotypes with a statistically different response to exogenous allyl treatment in comparison to Col-0. See Table 1 for T-DNA insertion lines details.

References

    1. Atwell S., Huang Y., Vilhjalmsson B. J., Willems G., Horton M., Li Y., et al. (2010). Genome-wide association study of 107 phenotypes in a common set of Arabidopsis thaliana in-bred lines. Nature 465, 627–631. 10.1038/nature08800 - DOI - PMC - PubMed
    1. Baldwin I. T. (1998). Jasmonate-induced responses are costly but benefit plants under attack in native populations. Proc. Natl. Acad. Sci. U.S.A. 95, 8113–8118. 10.1073/pnas.95.14.8113 - DOI - PMC - PubMed
    1. Barlier I., Kowalczyk M., Marchant A., Ljung K., Bhalerao R., Bennett M., et al. . (2000). The SUR2 gene of Arabidopsis thaliana encodes the cytochrome P450CYP83B1, a modulator of auxin homeostasis. Proc. Natl. Acad. Sci. U.S.A. 97, 14819–14824. 10.1073/pnas.260502697 - DOI - PMC - PubMed
    1. Bednarek P. (2012). Sulfur-containing secondary metabolites from Arabidopsis thaliana and other brassicaceae with function in plant immunity. Chembiochem 13, 1846–1859. 10.1002/cbic.201200086 - DOI - PubMed
    1. Bednarek P., Piślewska-Bednarek M., Svatoš A., Schneider B., Doubský J., Mansurova M., et al. . (2009). A glucosinolate metabolism pathway in living plant cells mediates broad-spectrum antifungal defense. Science 323, 101–106. 10.1126/science.1163732 - DOI - PubMed

LinkOut - more resources