Review
. 2016 Jul 25:9:23.
doi: 10.1186/s13040-016-0102-8. eCollection 2016.

Representing and querying disease networks using graph databases

Affiliations
Review

Representing and querying disease networks using graph databases

Artem Lysenko et al. BioData Min. .

Abstract

Background: Systems biology experiments generate large volumes of data of multiple modalities and this information presents a challenge for integration due to a mix of complexity together with rich semantics. Here, we describe how graph databases provide a powerful framework for storage, querying and envisioning of biological data.

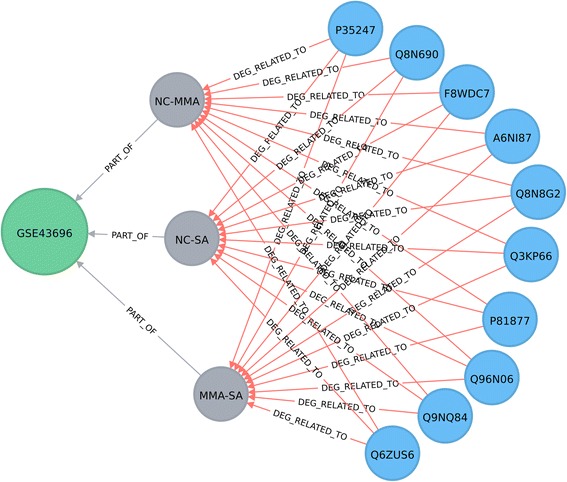
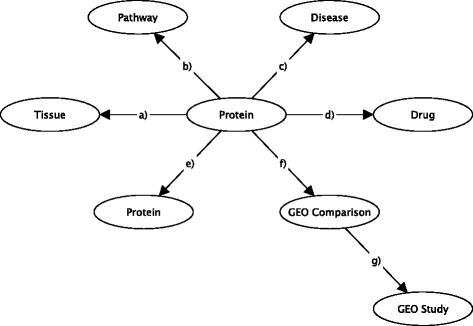
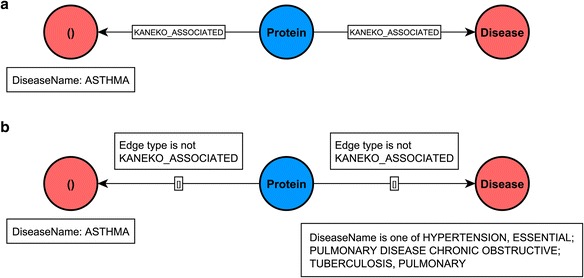
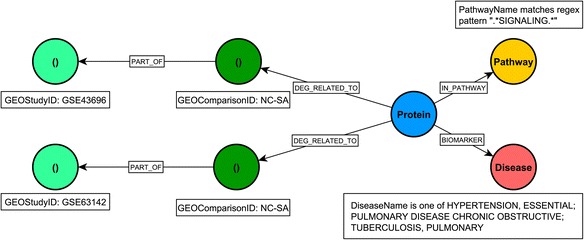
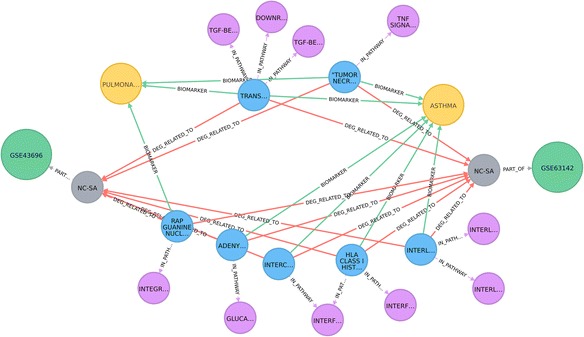
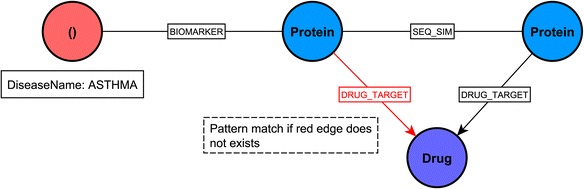
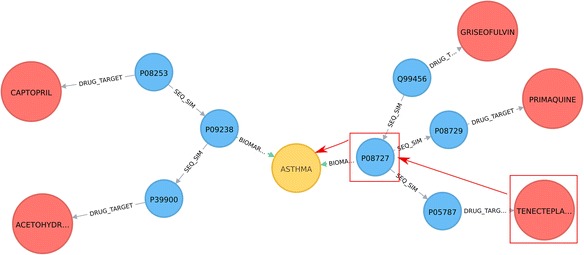
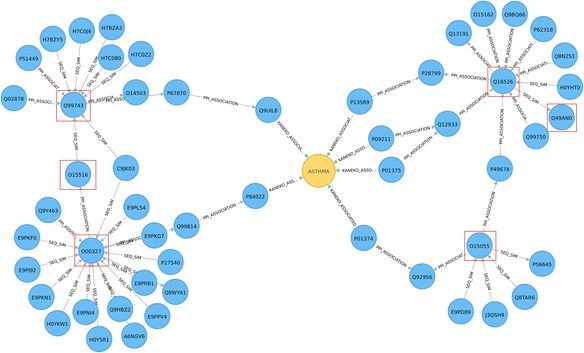
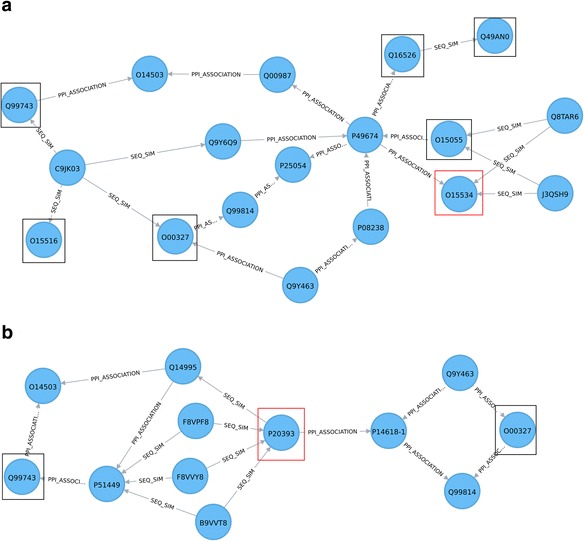
Results: We show how graph databases are well suited for the representation of biological information, which is typically highly connected, semi-structured and unpredictable. We outline an application case that uses the Neo4j graph database for building and querying a prototype network to provide biological context to asthma related genes.

Conclusions: Our study suggests that graph databases provide a flexible solution for the integration of multiple types of biological data and facilitate exploratory data mining to support hypothesis generation.

Keywords: Computational approach; Disease management platform; Graph database; Neo4j graph; Protein-centric framework; Systems medicine.


Figures

Fig. 1
Fig. 1
The data model for inclusion of results from gene expression studies. The Protein nodes, (blue), are associated to the GEO Comparison nodes (grey) by the DEG RELATED TO edges, (red); relationships between GEO Comparison and GEO Study nodes (green) are represented by the PART OF edges, (green). The key for i) the Protein node is given by the UniProt identifier, ii) the GEO Study node by its name and iii) the GEO Comparison node by the GSM samples that are compared. Information on adjusted p-values of the differentially expressed genes is stored as a property for the DEG RELATED TO edges. This simplified illustration includes only 10 differentially expressed proteins for the GSE43696 study [24], with similar representation for other studies. NC: normal control; MMA: mild-moderate asthma; SA: severe asthma
Fig. 2
Fig. 2
The Data Model: Schematic representation of biological information on proteins, pathways, tissues, disease and drugs, and the names of the GEO data sources, (GEO Study id, GSM sample type comparison), represented by nodes in the graph database. Relationships between these entities are shown by edges and refer to associations between: a) protein-tissue, (TISSUEENHANCED); b) protein-pathway (IN PATHWAY); c) protein-disease (BIOMARKER, GENETIC VARIATION, THERAPEUTIC, KANEKO ASSOCIATION); d) protein-drug (DRUG TARGET, DRUG ENZYME, DRUG CARRIER, DRUG TRANSPORTER), e) protein-protein (PPI ASSOCIATION, PPI COLOCALIZATION, PPI GENETIC INTERACTION, SEQ SIM); f) protein-GEO Comparison (DEG RELATED TO) and g) GEO Comparison-GEO Study (PART OF)
Fig. 3
Fig. 3
A visual schematic representation of graph patterns matched by queries in listing 1 (a panel) and 2 (b panel)
Fig. 4
Fig. 4
A visual schematic representation of graph pattern matched by query in listing 3
Fig. 5
Fig. 5
Disease – Protein-Signalling pathways associations: Common set of normal control - severe asthma DEGs for GSE43696 [24] and GSE63142 [25] series and their associations with respiratory diseases and signalling pathways. Node colour: protein, blue; GEO Comparison, grey; pathway, violet; disease, yellow. Edges: GEO comparison - GEO study relationship, grey; protein-pathway association, violet; DEG association, red; biomarker, green
Fig. 6
Fig. 6
A visual schematic representation of graph pattern matched by query in listing 4
Fig. 7
Fig. 7
Drugs that target proteins, which have sequence similarity to asthma biomarkers. No information on direct target interaction between these drugs and biomarkers is given in the database a priori. Nodes colours: protein, blue; disease, yellow; drug, red. Edges: drug-target associations, red; sequence similarity relationships, grey; biomarker, green
Fig. 8
Fig. 8
Shortest paths (of length < 4) between core clock components (red squares) and asthma-related proteins in the network. Node colour: disease, yellow; protein, blue. Edges: KANEKO association, blue; PPI association, red; sequence similarity relationship, grey
Fig. 9
Fig. 9
Shortest path queries to explore relationships between a) the O15534 protein (PER1 gene) and b) the P20393 protein (REV-ErbA-alpha gene) and the circadian core genes, (Table 3). a In terms of distance in graph, the O15534 protein (PER1 gene) (red square), transcriptional repressor, is closer to O15055 (PER2), Q16526 (CRY1) and Q49AN0 (CRY2), (transcriptional repressors), than to O15516 (CLOCK), O00327 (ARNTL/BMAL1) and Q99743 (NPAS2), (transcriptional activators). The circadian core genes are shown by black squares. b The P20393 protein (REV-ErbA-alpha gene) (red square), suggested to be involved in the disruption of clock genes [27], can be seen 3 steps away from the O00327(ARNTL/BMAL1) and Q99743(NPAS2) core clock genes (black squares). Node colour: protein, blue. Edges: PPI association, red; sequence similarity relationship, grey

References

    1. Auffray C, Charron D, Hood L. Predictive, preventive, personalized and participatory medicine: back to the future. Genome Med. 2010;2:57. doi: 10.1186/gm178. - DOI - PMC - PubMed
    1. Hood L, Tian Q. Systems approaches to biology and disease enable translational systems medicine. Genomics Proteomics Bioinformatics. 2012;10:181–185. doi: 10.1016/j.gpb.2012.08.004. - DOI - PMC - PubMed
    1. Callahan A, Cruz-Toledo J, Ansell P, Dumontier M, et al. Bio2RDF release 2: improved coverage, interoperability and provenance of life science linked data. In: Cimiano P, Corcho O, Presutti V, et al., editors. Semantic Web Semant. Berlin Heidelberg: Big Data. Springer; 2013. pp. 200–212.
    1. Pareja-Tobes P, Tobes R, Manrique M, et al. Bio4j: a high-performance cloud-enabled graph-based data platform. bioRxiv 016758. 2015. doi: http://dx.doi.org/10.1101/016758. - DOI
    1. Smoot ME, Ono K, Ruscheinski J, et al. Cytoscape 2.8: new features for data integration and network visualization. Bioinformatics. 2011;27(3):431–32. doi:10.1093/bioinformatics/btq675. - PMC - PubMed