. 2015 Apr 28:1:15002.
doi: 10.1038/celldisc.2015.2. eCollection 2015.

A novel role for synaptic acetylcholinesterase as an apoptotic deoxyribonuclease

Affiliations

A novel role for synaptic acetylcholinesterase as an apoptotic deoxyribonuclease

Aiying Du et al. Cell Discov. .

Abstract

In addition to terminating neurotransmission by hydrolyzing acetylcholine, synaptic acetylcholinesterase (AChES) has been found to have a pro-apoptotic role. However, the underlying mechanism has rarely been investigated. Here, we report a nuclear translocation-dependent role for AChES as an apoptotic deoxyribonuclease (DNase). AChES polypeptide binds to and cleaves naked DNA at physiological pH in a Ca(2+)-Mg(2+)-dependent manner. It also cleaves chromosomal DNA both in pre-fixed and in apoptotic cells. In the presence of a pan-caspase inhibitor, the cleavage still occurred after nuclear translocation of AChES, implying that AChES-DNase acts in a CAD- and EndoG-independent manner. AChE gene knockout impairs apoptotic DNA cleavage; this impairment is rescued by overexpression of the wild-type but not (aa 32-138)-deleted AChES. Furthermore, in comparison with the nuclear-localized wild-type AChES, (aa 32-138)-deleted AChES loses the capacity to initiate apoptosis. These observations confirm that AChES mediates apoptosis via its DNase activity.

Keywords: DNA cleavage; DNA-binding protein; apoptosis; deoxyribonuclease; nuclear translocation; synaptic acetylcholinesterase.


Figures

Figure 1
Figure 1
Synaptic acetylcholinesterase (AChES) initiates apoptosis in the nuclear compartment. (a) Time-lapse images showing the alteration of the distribution of the indicated proteins during apoptosis. HeLa cells were transfected with the plasmids expressing the indicated fusion proteins. After 24 h, cells were exposed to 100 μM H2O2 and time-lapse images were captured using a Leica AS MDW live cell image acquisition system. See also Supplementary Video S1a. (b) Western blot analysis of fusion protein expression. HeLa cells were transfected with the empty plasmid as a control or the indicated fusion protein expression plasmids. After 24 h, cells were harvested. Whole-cell extracts were prepared, resolved by SDS–polyacrylamide gel electrophoresis, and blotted with anti-GFP antibody (Abmart, M20004). (c) Confocal images showing deoxynucleotidyl transferase (TdT)-mediated dUTP nick end labeling (TUNEL) staining in HeLa cells transfected with the plasmids expressing the indicated proteins. At 48 h after transfection, TUNEL assays were performed. Cells expressing green fluorescence protein (GFP) alone were used as the empty plasmid control, and those expressing histone H2B were used as the negative control. Scale bars, 15 μm. In the detailed image, the cells are indicated by an arrowhead (right panel; ×2 magnification). (d) DNA ladder assay for apoptosis triggered by the indicated proteins overexpressed in HeLa cells for 48 h. (e) Images showing the GFP-positive HeLa cells. At 18 h after transfection, GFP-positive HeLa cells were sorted by fluorescence-activated cell sorting. At 72 h after sorting, the images were taken using an inverted fluorescence microscope. Scale bar, 30 μM. (f) The viability curves of GFP-positive HeLa cells overexpressing the indicated proteins after sorting. The relative number of cells at the indicated time points was determined by the 3-(4,5-dimethylthiazol-2-yl)-2,5-diphenyltetrazoliumbromide (MTT) assay, with measurement of optical density (OD) at 570 nm. The data are presented as the mean±s.d. of triplicate samples from one experiment that is a representative of three independent experiments. NLS, nuclear localization signal.
Figure 1
Figure 1
Synaptic acetylcholinesterase (AChES) initiates apoptosis in the nuclear compartment. (a) Time-lapse images showing the alteration of the distribution of the indicated proteins during apoptosis. HeLa cells were transfected with the plasmids expressing the indicated fusion proteins. After 24 h, cells were exposed to 100 μM H2O2 and time-lapse images were captured using a Leica AS MDW live cell image acquisition system. See also Supplementary Video S1a. (b) Western blot analysis of fusion protein expression. HeLa cells were transfected with the empty plasmid as a control or the indicated fusion protein expression plasmids. After 24 h, cells were harvested. Whole-cell extracts were prepared, resolved by SDS–polyacrylamide gel electrophoresis, and blotted with anti-GFP antibody (Abmart, M20004). (c) Confocal images showing deoxynucleotidyl transferase (TdT)-mediated dUTP nick end labeling (TUNEL) staining in HeLa cells transfected with the plasmids expressing the indicated proteins. At 48 h after transfection, TUNEL assays were performed. Cells expressing green fluorescence protein (GFP) alone were used as the empty plasmid control, and those expressing histone H2B were used as the negative control. Scale bars, 15 μm. In the detailed image, the cells are indicated by an arrowhead (right panel; ×2 magnification). (d) DNA ladder assay for apoptosis triggered by the indicated proteins overexpressed in HeLa cells for 48 h. (e) Images showing the GFP-positive HeLa cells. At 18 h after transfection, GFP-positive HeLa cells were sorted by fluorescence-activated cell sorting. At 72 h after sorting, the images were taken using an inverted fluorescence microscope. Scale bar, 30 μM. (f) The viability curves of GFP-positive HeLa cells overexpressing the indicated proteins after sorting. The relative number of cells at the indicated time points was determined by the 3-(4,5-dimethylthiazol-2-yl)-2,5-diphenyltetrazoliumbromide (MTT) assay, with measurement of optical density (OD) at 570 nm. The data are presented as the mean±s.d. of triplicate samples from one experiment that is a representative of three independent experiments. NLS, nuclear localization signal.
Figure 2
Figure 2
Interaction between synaptic acetylcholinesterase (AChES) polypeptide with plasmid DNA. (a) Silver staining and western blot showing the purified human AChES polypeptide, hAChE-T547. The anti-AChE antibody provided by Dr Palmer Taylor was used at a dilution of 1:1000. (b) Cholinesterase activity of hAChE-T547 examined by the Ellman assay, with measurement of optical density (OD) 405 nm. Data shown represent one of three independent experiments. Values represent the mean±s.d. of triplicate samples. (c) The interaction between hAChE-T547 and pEGFP-c1 plasmid DNA examined by Biacore T100. DNase I and bovine serum albumin (BSA) were used as positive and negative controls, respectively. Data shown represent one of three independent experiments.
Figure 3
Figure 3
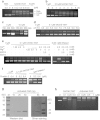
Purified synaptic acetylcholinesterase polypeptide cleaves DNA in a cell-free hydrolysis system. (a) Agarose gel images showing pEGFP-c1 plasmid DNA (150 ng) incubated with purified hAChE-T547 at the indicated concentration at 37 °C for 6 h. EcoRI-digested DNA (0.5 U/μl) was used to demarcate the linearized plasmid. Bovine serum albumin (BSA) was used as a negative control. (b) Agarose gel images of pEGFP-c1 plasmid DNA (150 ng) incubated with 0.5 μM hAChE-T547 at 37 °C for the indicated time periods. (c) Agarose gel images of pEGFP-c1 plasmid DNA (150–600 ng) incubated with or without 0.5 μM hAChE-T547 at 37 °C for 6 h. (d) Agarose gel images showing pEGFP-c1 plasmid DNA (150 ng) incubated with 0.1 μM hAChE-T547 at different pH at 37 °C for 6 h. (e) Effects of Mg2+ and (or) Ca2+ on DNA cleavage activity of hAChE-T547. The hydrolysis buffer containing Mg2+ and (or) Ca2+ at the indicated concentration was pre-incubated in the presence or absence of ethylene glycol tetraacetic acid (EGTA)/EDTA at 37 °C for 1 h. hAChE-T547 and pEGFP-c1 plasmid DNA (150 ng) was then added and the incubation continued for a further 6 h. DNase I was used as a positive control. (f) The effects of G-actin on DNA cleavage activity of hAChE-T547. hAChE-T547 and DNase I were pre-incubated with G-actin at the indicated concentration in the hydrolysis buffer at 37 °C for 1 h. pEGFP-c1 plasmid DNA (150 ng) was then added and the incubation continued for a further 6 h. DNase I was used as a positive control. (g) Silver staining and western blot showing the purified human caspase-activated deoxyribonuclease (CAD) (Arg87–Lys323; predicted molecular mass: 31.9 kDa) (USCN Life Science, Wuhan, China). The anti-CAD antibody (Merck Millipore, Darmstadt, Germany, AB16926) was used at a dilution of 1:500. (h) Agarose gel images showing pEGFP-c1 plasmid DNA (150 ng) incubated with purified hAChE-T547 and CAD/DFF40, respectively, at the indicated concentration at 37 °C for 6 h. SC, supercoiled.
Figure 4
Figure 4
The N terminus of synaptic acetylcholinesterase (AChES) exhibits the pro-apoptotic and DNA cleavage functions. (a) A schematic diagram of human AChES and the truncated AChES (tAChES) with distinct C termini. (b) The viability curves of green fluorescence protein (GFP)-positive HeLa cells overexpressing the indicated proteins during 72 h after sorting. The relative number of cells at the indicated time points was determined by the 3-(4,5-dimethylthiazol-2-yl)-2,5-diphenyltetrazoliumbromide assay. The data are presented as the mean±s.d. of triplicate samples from one representative of three independent experiments. (c) Images obtained using inverted phase-contrast microscopy showing GFP-positive HeLa cells at 72 h after sorting. Scale bar, 30 μm. (d) Agarose gel images showing pEGFP-c1 plasmid DNA (150 ng) incubated with the synthesized hAChE-T107 at the indicated concentration at 37 °C for 6 h. (e) Agarose gel images of pEGFP-c1 plasmid DNA (150 ng) incubated with 10 μM hAChE-T107 at 37 °C for the indicated time periods. (f) Agarose gel images of pEGFP-c1 plasmid DNA (75–300 ng) incubated with or without 10 μM hAChE-T107 at 37 °C for 6 h. (g) Agarose gel images of pEGFP-c1 plasmid DNA (150 ng) incubated with 2.5 μM hAChE-T107 at different pH at 37 °C for 6 h. (h) Effects of Mg2+ and (or) Ca2+ on DNA cleavage activity of hAChE-T107. The assay protocol was similar to that described in Figure 3e, except that 2.5 μM hAChE-T107 was added and the incubation continued for 8 h. EGTA, ethylene glycol tetraacetic acid; NLS, nuclear localization signal; OD, optical density.
Figure 5
Figure 5
Synaptic acetylcholinesterase (AChES) polypeptides digest chromosomal DNA in pre-fixed HeLa cells. HeLa cells were pre-fixed with 4% paraformaldehyde and permeabilized with 0.5% Triton X-100 before incubation with hAChES polypeptides. (a) Confocal images showing deoxynucleotidyl transferase (TdT)-mediated dUTP nick end labeling (TUNEL)-stained nuclei of HeLa cells. The pre-fixed and permeabilized HeLa cells were incubated with hAChE-T547 (0.2 μM) (left panel) or with hAChE-T107 (5 μM) (right panel) at 37 °C for 6 h. The TUNEL assay was then performed and the confocal images were taken. Bovine serum albumin (BSA) (0.2 μM) and T41 (5 μM) were used as negative controls, respectively. Scale bar, 20 μm. (b) Agarose gel images showing DNA fragmentation in pre-fixed HeLa cells incubated with hAChE-T547 (21 μM) at 37 °C overnight. BSA (21 μM) was used as a negative control. DAPI, 4',6-diamidino-2-phenylindole.
Figure 6
Figure 6
Endogenous synaptic acetylcholinesterase (AChES) participates in DNA cleavage via aa 32–138 during apoptosis. (a) Immunoblot analysis of the apoptosis induced by mitomycin C (MMC) in mouse embryonic fibroblasts (MEFs). The cells were treated with MMC (40 μM) for 36 h prior to western blot analysis to detect cleaved poly(adenosine diphosphate ribose) polymerase (PARP) (a biomarker of apoptosis) using PARP antibody (Cell Signaling Technology, #9545). (b) Identification of AChE knockout embryonic mice by reverse transcription-PCR. (c) Confocal images showing DNA cleavage in apoptotic AChE+/+ or AChE−/− MEFs. Cells were seeded (5×10⁴) on coverslips in a 24-well plate. Upper panels: 48 h later, the cells were treated with 40 μM MMC (Sigma-Aldrich) for 36 h and the TUNEL assay was performed. Lower panels: at 4 h after seeding, the cells were infected with lentiviruses encoding the indicated proteins, where ‘wt’ indicates wt-AChES–GFP and ‘Δ’ indicates AChES Δ (aa 32–138)-GFP. After a further 44 h, the infected cells were exposed to 40 μM MMC for 36 h. Then, the TUNEL assay was performed and analyzed by confocal microscopy. Scale bar, 20 μm. (d) Average intensity of TUNEL staining in MEFs was quantified by Leica Confocal Software. Fifty cells were randomly selected and analyzed in each experimental group in c. Values represent the mean±s.d. **P<0.01, ***P<0.001, # P>0.05 vs AChE−/− MEFs without virus infection. Two-tailed Student’s t-test. The data shown are representative of two independent experiments. DAPI, 4',6-diamidino-2-phenylindole; GFP, green fluorescence protein.
Figure 7
Figure 7
Endogenous synaptic acetylcholinesterase (AChES) participates in apoptosis via aa 32–138. (a) Cell viability curves of mouse embryonic fibroblasts (MEFs). AChE+/+ and AChE−/− MEFs were added to 96-well plates (2×10⁴ cells/well). After 24 h, the cells were treated with or without mitomycin C (MMC) (40 μM) or cisplatin (40 μM) (Sigma-Aldrich). The percentage of viable cells at the indicated time points was detected by the 3-(4,5-dimethylthiazol-2-yl)-2,5-diphenyltetrazoliumbromide assay. **P<0.01, ***P<0.001. The data are presented as the mean±s.d. of triplicate samples from one experiment that is a representative of three independent experiments. (b) BALB/c mice bearing tumors on day 26 after subcutaneous injection of HeLa cells. HeLa cells stably expressing the indicated proteins were counted and collected by fluorescence-activated cell sorting and then subcutaneously injected into Balb/c mice (5×10⁶ cells/mouse). (c) Tumors isolated from the mouse in the correlating panel in b. (d) Tumor growth curve. From 5 days after cell injection, the size of tumors was measured every 3 days using vernier calipers. Tumor volume was calculated using the formula: V=ab 2 π/6, where ‘a’ represents the length and ‘b’ represents the width. GFP, green fluorescence protein; NLS, nuclear localization signal.

Similar articles

Cited by

References

    1. Meshorer E , Toiber D , Zurel D , et al. Combinatorial complexity of 5′ alternative acetylcholinesterase transcripts and protein products. J Biol Chem 2004; 279: 29740–29751. - PubMed
    1. Grisaru D , Sternfeld M , Eldor A , Glick D , Soreq H . Structural roles of acetylcholinesterase variants in biology and pathology. Eur J Biochem 1999; 264: 672–686. - PubMed
    1. Xie J , Jiang H , Wan YH , et al. Induction of a 55 kDa acetylcholinesterase protein during apoptosis and its negative regulation by the Akt pathway. J Mol Cell Biol 2011; 3: 250–259. - PubMed
    1. Zhang XJ , Yang L , Zhao Q , et al. Induction of acetylcholinesterase expression during apoptosis in various cell types. Cell Death Differ 2002; 9: 790–800. - PubMed
    1. Jing P , Jin QH , Wu J , Zhang XJ . GSK3 beta mediates the induced expression of synaptic acetylcholinesterase during apoptosis. J Neurochem 2008; 104: 409–419. - PubMed

LinkOut - more resources