. 2015 Dec 1:1:15034.
doi: 10.1038/celldisc.2015.34. eCollection 2015.

A genome-wide IR-induced RAD51 foci RNAi screen identifies CDC73 involved in chromatin remodeling for DNA repair

Affiliations

A genome-wide IR-induced RAD51 foci RNAi screen identifies CDC73 involved in chromatin remodeling for DNA repair

Patrick Herr et al. Cell Discov. .

Abstract

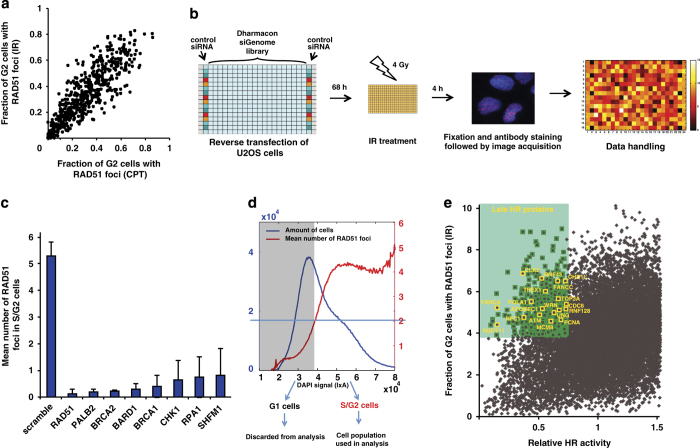
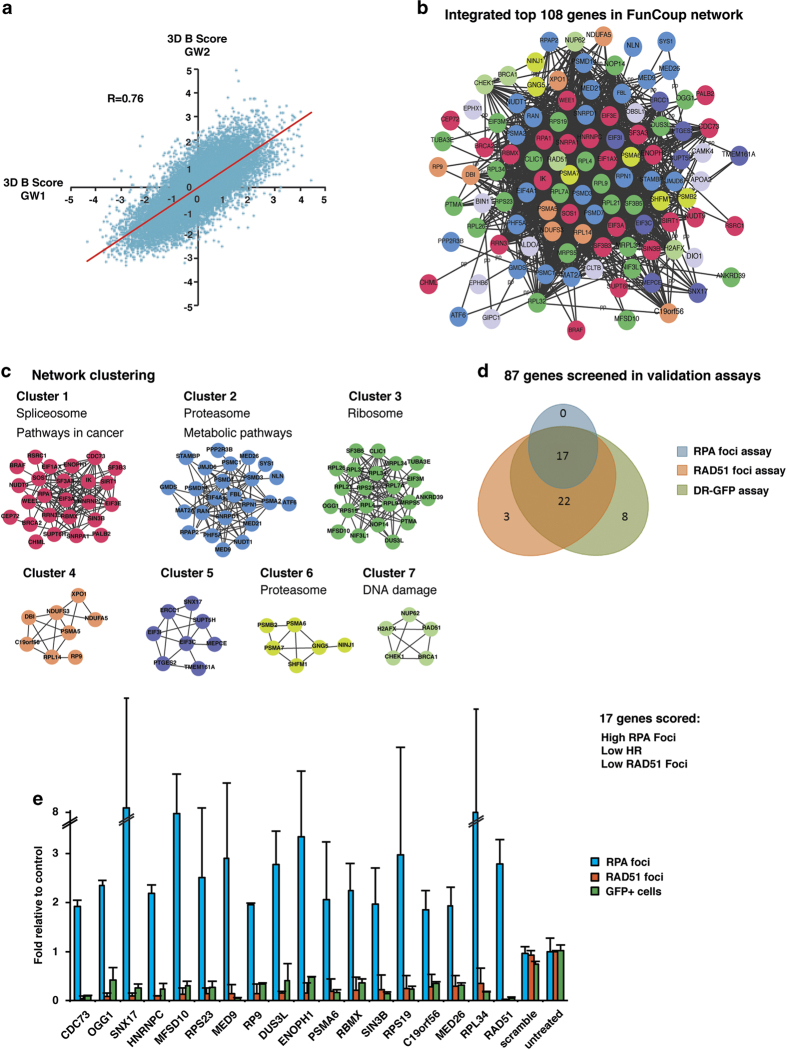
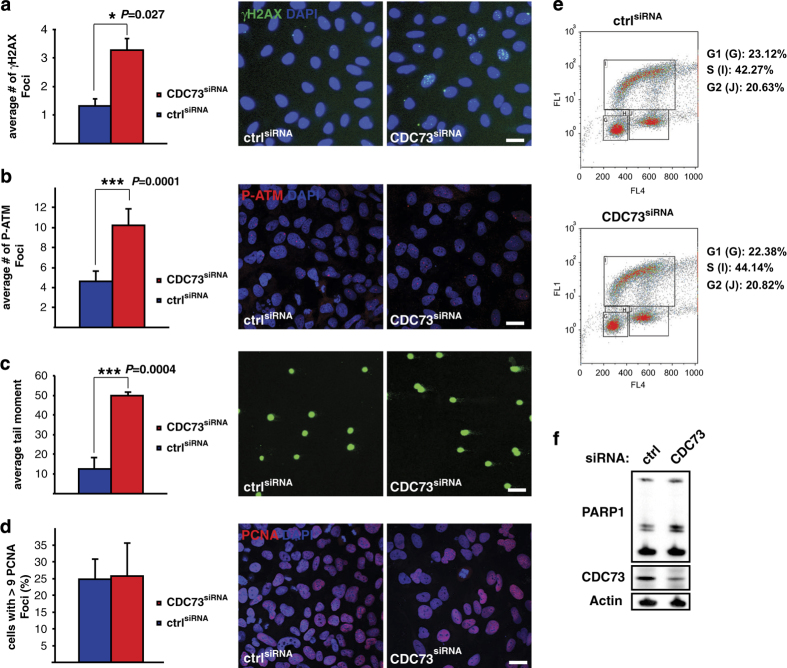
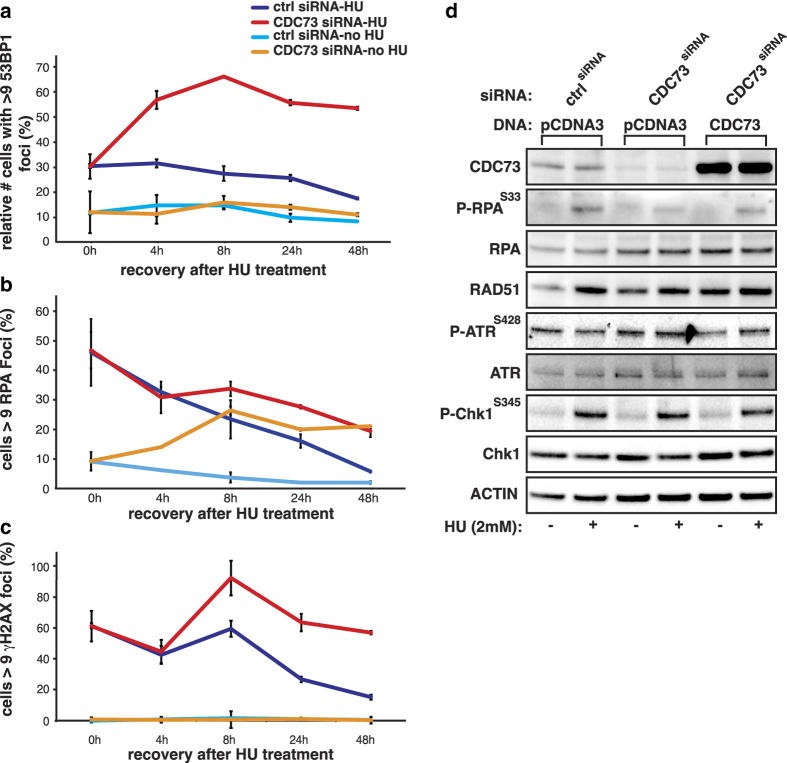
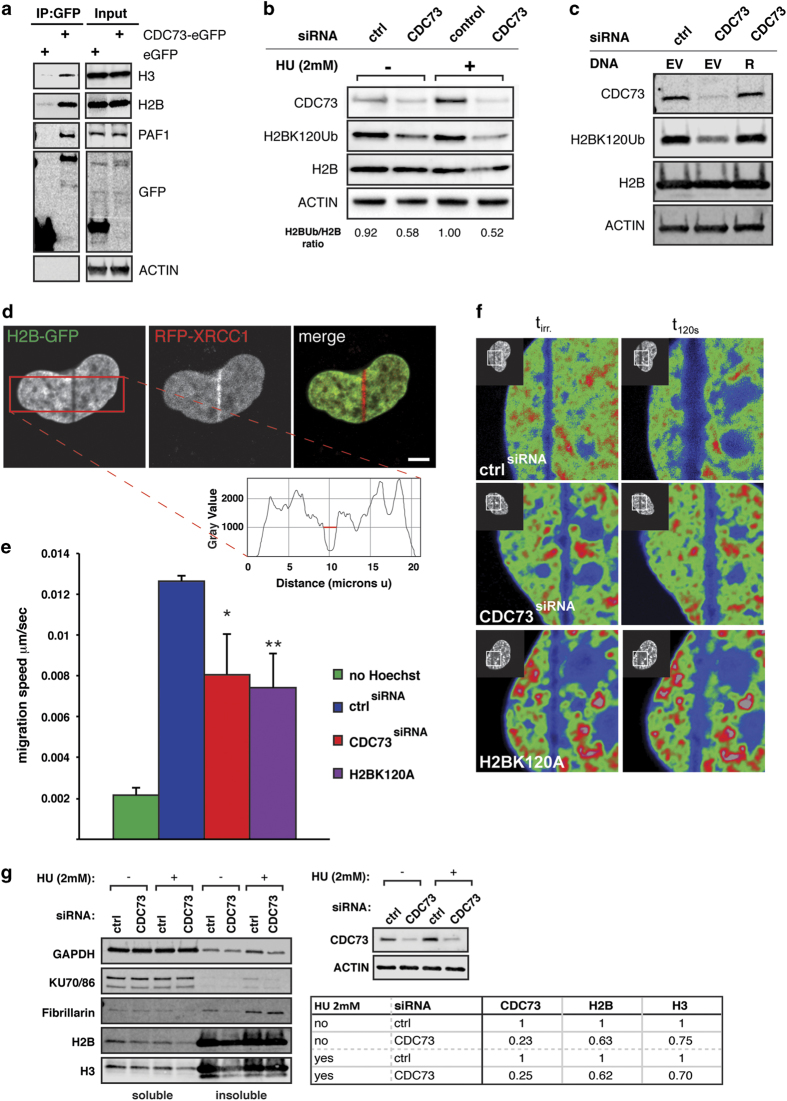
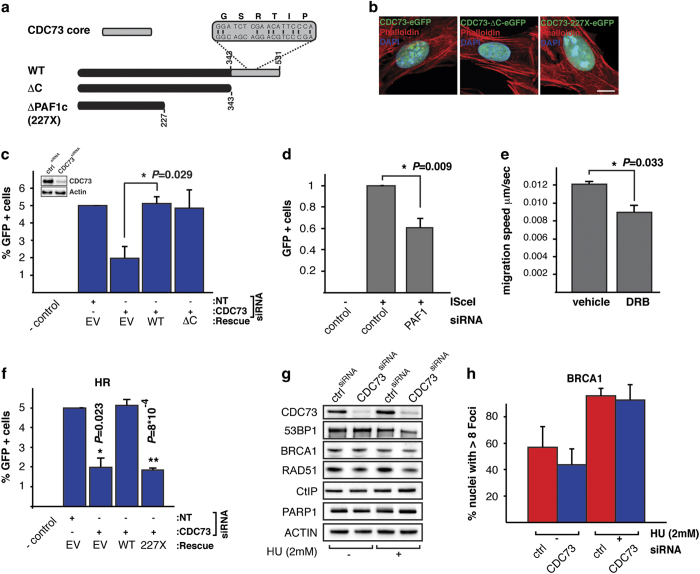
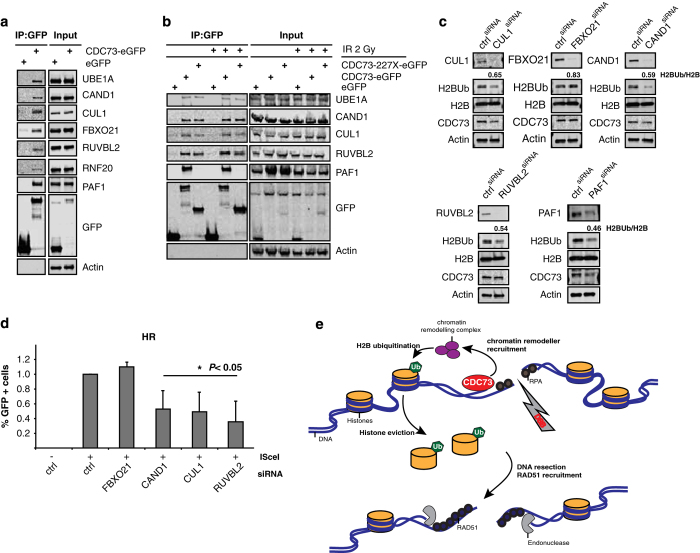
To identify new regulators of homologous recombination repair, we carried out a genome-wide short-interfering RNA screen combined with ionizing irradiation using RAD51 foci formation as readout. All candidates were confirmed by independent short-interfering RNAs and validated in secondary assays like recombination repair activity and RPA foci formation. Network analysis of the top modifiers identified gene clusters involved in recombination repair as well as components of the ribosome, the proteasome and the spliceosome, which are known to be required for effective DNA repair. We identified and characterized the RNA polymerase II-associated protein CDC73/Parafibromin as a new player in recombination repair and show that it is critical for genomic stability. CDC73 interacts with components of the SCF/Cullin and INO80/NuA4 chromatin-remodeling complexes to promote Histone ubiquitination. Our findings indicate that CDC73 is involved in local chromatin decondensation at sites of DNA damage to promote DNA repair. This function of CDC73 is related to but independent of its role in transcriptional elongation.

Keywords: CDC73; DNA repair; Parafibromin; RAD51; chromatin remodeling; genome-wide siRNA screen; homologous recombination; tumor suppressor.


Figures

Figure 1
Figure 1
(a) Irradiation (4 Gy) and treatment with CPT (1 μM) show very close correlation in RAD51 foci formation. (b) Layout and results of the primary genome-wide siRNA screen. Cells were reverse transfected with a siRNA library and irradiated with 4 Gy 68 h after siRNA transfection. At 72 h after siRNA transfection, cells were fixed and imaged with an InCell Analyzer. Final data analysis was performed using MatLab (MathWorks, Natick, MA, USA). (c) Mean RAD51 foci numbers and s.d. for known HR proteins from the two duplicate runs. (d) Cells were sorted according to DNA content by only counting cells in the S/G2 phase. Plot showing mean number of RAD51 foci over a histogram for DAPI intensity. G1 to S-phase transition was set at DAPI intensity where mean number of RAD51 foci is 2 (horizontal blue line). (e) Illustration of late HR proteins in a green shading, which is defined by defective repair of the DR–GFP reporter but rather normal recruitment of RAD51.
Figure 2
Figure 2
Schematic for how siRNAs were picked for validation. (a) 3D-B scores from the duplicate siRNA screens for RAD51 foci were combined with good correlation (R=0.76). (b) The top 200 candidate genes were mapped to the human FunCoup network resulting in a subnetwork of 108 genes. (c) Network clustering resulted in 7 sub-clusters from which 87 genes were selected for validation assays. The clusters provide more detailed functional annotation, determined by significantly enriched KEGG pathways. (d) Forty-two of the siRNAs that were validated showed significantly lower levels of RAD51 foci compared with control. Of these, 39 also had significantly lower HR-activity in the DR–GFP assay and 17 confirmed an HR-defect in all 3 validation assays (that is, low RAD51 foci levels, increased RPA foci levels and low levels of GFP+ cells in the DR–GFP assay). (e) Results of the 17 siRNAs that had significantly different levels compared with the control in the validation assays. Data showing mean fold values and s.d. from two independent experiments.
Figure 3
Figure 3
CDC73 silencing leads to genome instability. (a and b) Average number of γH2AX and P-ATM foci in U2OS cells depleted for CDC73 is significantly increased compared with control (*P=0.027 and ***P=0.001, respectively). (c) Comet Assay with siRNA-transfected U2OS cells. CDC73 depletion leads to significantly increased DNA damage as analyzed by the average tail moment (***P=0.004). (d) Normal S-phase distribution in CDC73-depleted cells based on PCNA staining. (e) CDC73 knockdown cells do not undergo cell cycle arrest and show a normal rate of BrdU incorporation as analyzed by FACS and propidium iodine counterstain. (f) CDC73 silencing does not lead to apoptosis measured by the amount of cleaved PARP1 on western blot. For all experiments n⩾2. Average and s.d. are plotted. P-values are calculated with Student’s t-test and scale bars represent 50 μm.
Figure 4
Figure 4
Loss of CDC73 results in delayed resolution of DNA DSB. Cells were followed over 48 h after being released from HU (2 mm per 12 h) treatment. (ac) 53BP1, RPA and γH2AX are not released from sites of damage in CDC73 knockdown cells. (b) CDC73 knockdown alone steadily increases the accumulation of RPA. (d) RPA phosphorylation is reduced in CDC73 knockdown but ATR expression and activity are not affected (n⩾2). Average and s.d. are plotted. Scale bars represent 50 μm.
Figure 5
Figure 5
CDC73 silencing leads to impaired H2B ubiquitination and reduced DNA damage-induced H2B release. (a) CDC73 binds to Histones H2B and H3 in co-immunoprecipitation experiments. PAF1 serves as a positive control. (b) H2BK120Ub is reduced in CDC73 knockdown cells. The effect is enhanced after exposure to HU (2 mm). Calculated ratios (H2Bub/H2B) are indicated below the blot. (c) CDC73 silencing leads to decreased ubiquitination on H2BK120, which is rescued by expression of a siRNA-resistant CDC73 construct (R) (EV, empty vector control transfection). (d) Low energy laser irradiation (405nm) leads to DNA damage-induced recruitment of red fluorescent protein–XRCC1. (e) Cells were analyzed for the migration speed of H2B–GFP away from the site of DNA damage. Quantification was done using the plot profile tool in ImageJ (inlet) in the indicated area (red square in d) and the distance was measured at a defined gray value for start and end time points (red line). Each experiment was repeated at least 3 times and at least 10 cells were analyzed per experiment (Average and s.d. P-values are calculated with Student’s t-test and scale bar represents 5 μm). CDC73 silencing reduces the speed of H2B migration significantly (*P=0.017) and to a similar speed as the H2BK120A–GFP mutant (**P=0.006). (f) Representative images for the quantification in e (t irr, timepoint of irradiation; t 120s, 2 min after irradiation). Images are displayed in pseudocolors for better illustration. (g) H2B and H3 bind tighter to chromatin in absence of CDC73 at a salt concentration of 0.6 mm NaCl. GAPDH and Ku70/86 are shown as soluble controls. Ratios for CDC73 knockdown and H2B and H3 in the soluble fraction are quantified and summarized in the table.
Figure 6
Figure 6
The role of CDC73 in HRR is independent of its transcriptional function. (a) Illustration of the siRNA-resistant CDC73, the core mutant (ΔC) and the 227X mutant. (b) Immunofluorescence of the eGFP-tagged constructs in U2OS cells in combination with DAPI (blue) and Phalloidin (red). (c) The defect in HRR as measured by the DR–GFP assay can be rescued by re-expression of a WT (*P=0.029) and the ΔC mutant. (d) PAF1 silencing does reduce HRR (*P=0.009). (e) DRB treatment (50 μm, 2 h) has the same effect on H2B mobility as CDC73 silencing (*P=0.033). (f) The CDC73-227X mutant does not rescue HRR in the DR–GFP assay (**P=8×10⁻⁴). (g) CDC73 knockdown does not affect the expression of a number of essential genes for DNA repair and has no effect on the recruitment of BRCA1 (h). For all experiments (n⩾2). Average and s.d. are plotted. P-values are calculated with Student’s t-test and scale bars represent 50 and 10 μm.
Figure 7
Figure 7
CDC73 interacts with a number of chromatin-remodeling factors. (a) Co-IP with CDC73 confirmed its interaction with UBE1A, CAND1, CUL1, FBXO21, KU86, RUVBL2 and RNF20. PAF1 serves as a positive control and actin as a negative control. (b) The interactions are unchanged on IR treatment (2 Gy). (c) siRNA-mediated silencing of FBXO21, RUVBL2, CAND1, CUL1 and PAF1 leads to a decrease in H2BK120Ub. Ratios H2BK120Ub:H2B are indicated. (d) siRNA knockdown of CAND1, CUL1 and RUVBL2 leads to a similar decrease in homologous recombination repair as CDC73 knockdown (s.d. of average; more than three repeats). (e) Model describing the mode of action of CDC73 at DSB. CDC73 recruits chromatin-remodeling components that mediate H2BK120Ub and subsequent eviction of H2B from chromatin. The decondensed state of the chromatin allows repair enzymes to engage with DNA and proceed with resection and downstream DNA repair.

References

    1. Ciccia A , Elledge SJ . The DNA damage response: making it safe to play with knives. Mol Cell 2010; 40: 179–204. - PMC - PubMed
    1. West SC . Molecular views of recombination proteins and their control. Nat Rev Mol Cell Biol 2003; 4: 435–445. - PubMed
    1. Paulsen RD , Soni DV , Wollman R et al. A genome-wide siRNA screen reveals diverse cellular processes and pathways that mediate genome stability. Mol Cell 2009; 35: 228–239. - PMC - PubMed
    1. Adamson B , Smogorzewska A , Sigoillot FD et al. A genome-wide homologous recombination screen identifies the RNA-binding protein RBMX as a component of the DNA-damage response. Nat Cell Biol 2012; 14: 318–328. - PMC - PubMed
    1. Rozenblatt-Rosen O , Hughes CM , Nannepaga SJ et al. The parafibromin tumor suppressor protein is part of a human Paf1 complex. Mol Cell Biol 2005; 25: 612–620. - PMC - PubMed