. 2016 Aug 16;7(33):53783-53796.
doi: 10.18632/oncotarget.10776.

A pancreatic ductal adenocarcinoma subpopulation is sensitive to FK866, an inhibitor of NAMPT

Affiliations

A pancreatic ductal adenocarcinoma subpopulation is sensitive to FK866, an inhibitor of NAMPT

Marine Barraud et al. Oncotarget. .

Abstract

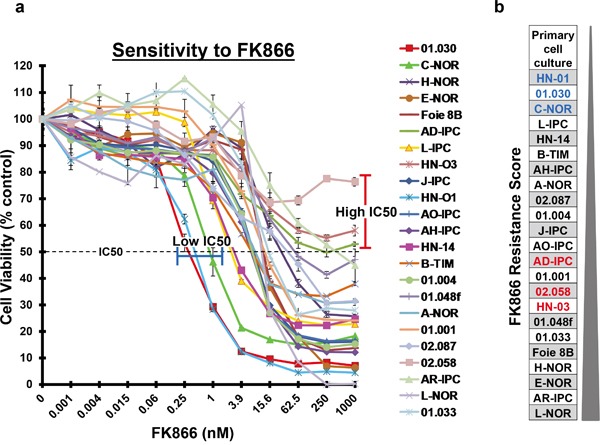
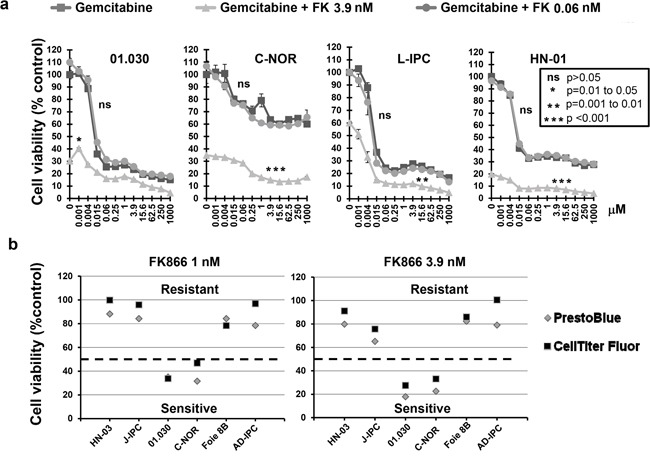
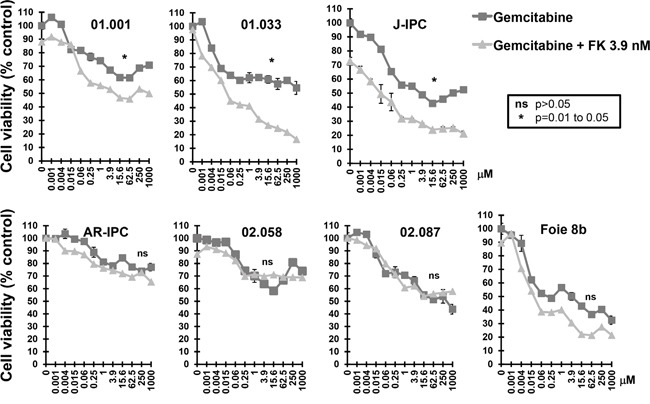
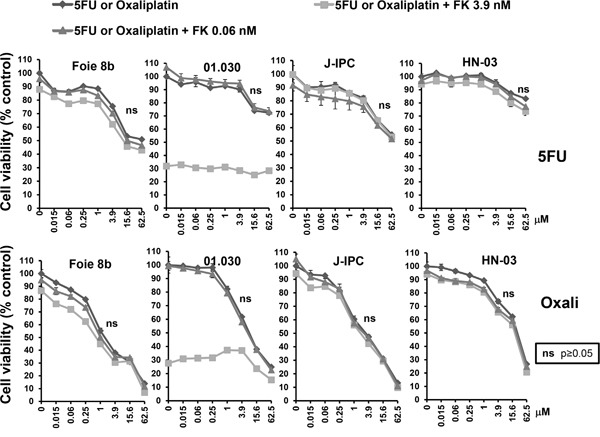
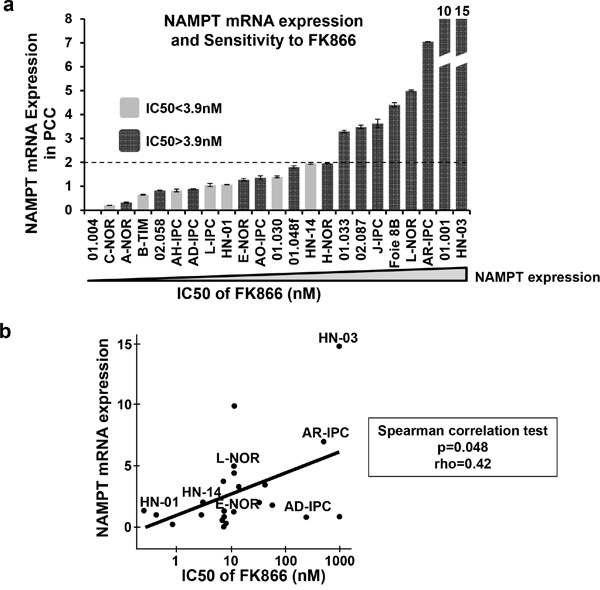
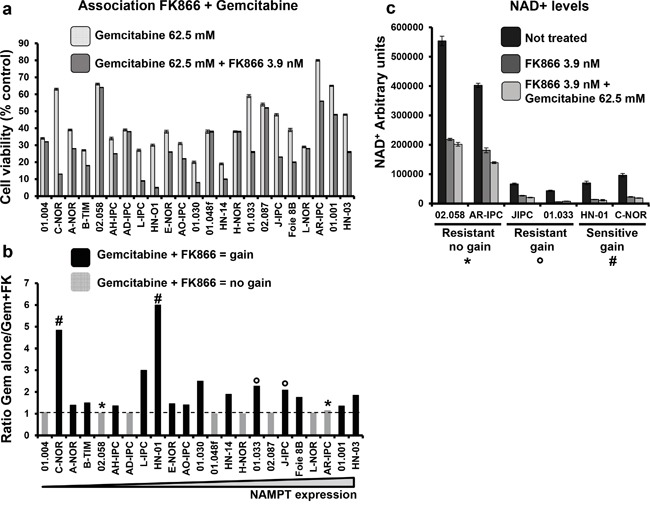
Treating pancreatic cancer is extremely challenging due to multiple factors, including chemoresistance and poor disease prognosis. Chemoresistance can be explained by: the presence of a dense stromal barrier leading to a lower vascularized condition, therefore limiting drug delivery; the huge intra-tumoral heterogeneity; and the status of epithelial-to-mesenchymal transition. These factors are highly variable between patients making it difficult to predict responses to chemotherapy. Nicotinamide phosphoribosyl transferase (NAMPT) is the main enzyme responsible for recycling cytosolic NAD+ in hypoxic conditions. FK866 is a noncompetitive specific inhibitor of NAMPT, which has proven anti-tumoral effects, although a clinical advantage has still not been demonstrated. Here, we tested the effect of FK866 on pancreatic cancer-derived primary cell cultures (PCCs), both alone and in combination with three different drugs typically used against this cancer: gemcitabine, 5-Fluorouracil (5FU) and oxaliplatin. The aims of this study were to evaluate the benefit of drug combinations, define groups of sensitivity, and identify a potential biomarker for predicting treatment sensitivity. We performed cell viability tests in the presence of either FK866 alone or in combination with the drugs above-mentioned. We confirmed both inter- and intra-tumoral heterogeneity. Interestingly, only the in vitro effect of gemcitabine was influenced by the addition of FK866. We also found that NAMPT mRNA expression levels can predict the sensitivity of cells to FK866. Overall, our results suggest that patients with tumors sensitive to FK866 can be identified using NAMPT mRNA levels as a biomarker and could therefore benefit from a co-treatment of gemcitabine plus FK866.

Keywords: FK866; NAMPT; chemotherapy; pancreatic cancer.


Conflict of interest statement

The authors disclose no conflicts of interest.

Figures

Figure 1
Figure 1. FK866 sensitivity of 23 PDAC-derived PCCs
a. Twenty-three PDAC-derived PCCs were treated for 72 h with increasing concentrations of FK866 ranging from 0 to 1000 nM. The horizontal dotted line indicates 50% cell viability. PCCs with the highest sensitivity are highlighted by a blue line and those with an IC50>1000 nM by a red line. b. PCCs were scored on their resistance to a fixed FK866 concentration of 3.9 nM, from the most sensitive to the most resistant. PCCs in blue are the ones that present the lowest IC50 and those in red have an IC50>1000 nM.
Figure 2
Figure 2. a. Effect of FK866-gemcitabine co-treatment on four PCCs most sensitive to FK866
Dose response curves represent cell viability with increasing concentrations of either gemcitabine alone or in combination with two concentrations of FK866 (0.06 and 3.9 nM). Three independent experiments were done (each one in triplicate) showing similar results. Significant difference between curves (p≤0.05) was analyzed by the Mann-whitne test. b. Comparison of cell viability measured with either PrestoBlue™ or Cell Titer-Fluor™ after FK866 treatment. Cell viability was measured with either PrestoBlue™ or Cell Titer-Fluor™ after 3 days treatment with two concentrations of FK866 (1 and 3.9 nM). The dotted horizontal line indicates 50% cell viability.
Figure 3
Figure 3. Sensitivity of FK866 resistant PCCs to co treatment with FK866-gemcitabine
Dose response curves represent cell viability with increasing concentrations of gemcitabine either alone or in combination with two concentrations of FK866 (3.9 nM). Three independent experiments were done (each one in triplicate) showing similar results. Significant differences between curves (p≤0.05) were analyzed by the Mann-whitne test.
Figure 4
Figure 4. Sensitivity of PCCs to co-treatment with FK866-5FU and FK866-oxaliplatin
Dose response curves represent cell viability at increasing concentrations of 5FU or oxaliplatin, either alone or in combination with two concentrations of FK866 (0.06 and 3.9 nM). Three independent experiments were done (each one in triplicate) showing similar results. Significant differences between curves (p≤0.05) were analyzed by the Mann-whitne test.
Figure 5
Figure 5. NAMPT mRNA expression levels in PCCs
a. PCCs were ordered according to their NAMPT expression level as determined by RT-qPCR (the lowest NAMPT expression level is on the left; highest on the right). The dark grey bars are FK866 resistant PCCs (FK866 IC50>3.9 nM); light grey bars are FK866 sensitive PCCs (FK866 IC50<3.9 nM). b. Correlation between FK866 IC50 and NAMPT mRNA expression for the 23 PCCs with Spearman correlation test (p=0.048); rho=0.42.
Figure 6
Figure 6. Correlation between NAMPT expression or FK866 sensitivity with either glucose/glutamine uptake or lactate/glutamate production
Primary cell cultures were ordered according to either their NAMPT transcriptional level a and b. or their FK866 IC50 c and d. For each of them we measured glucose and glutamine accumulated uptake, as well as lactate and glutamate production. The values obtained were normalized by the amount of protein.
Figure 7
Figure 7. Co-treatment of FK866-gemcitabine
a. Cell viability was measured and indicated as percentage of the control (untreated) after 3 days treatment with either 62.5 mM gemcitabine or 62.5 mM gemcitabine + 3.9 nM FK866. b. Ratio of treatment with gemcitabine alone / gemcitabine +FK866. The transversal line indicates ratio = 1. Values > 1 indicate a gain with the combined treatment and are represented by black bars on the graph. No gain from co-treatment is indicated by the light grey bars. c. NAD+ levels measured in: FK866 resistant cells presenting gain (*) or not (°) after treatment with gemcitabine; and FK866 sensitive cells (#). Cells were treated or not with FK866 alone or with FK866 + gemcitabine and NAD+ levels measured 24h later. Values are presented as arbitrary units and were normalized to cell number (see Material and Methods). Experiments were repeated 3 times and performed in triplicate.

References

    1. Neesse A, Michl P, Frese KK, Feig C, Cook N, Jacobetz MA, Lolkema MP, Buchholz M, Olive KP, Gress TM, Tuveson DA. Stromal biology and therapy in pancreatic cancer. Gut. 2011;60:861–868. - PubMed
    1. Samuel N, Hudson TJ. The molecular and cellular heterogeneity of pancreatic ductal adenocarcinoma. Nature reviews Gastroenterology & hepatology. 2012;9:77–87. - PubMed
    1. Guillaumond F, Leca J, Olivares O, Lavaut MN, Vidal N, Berthezene P, Dusetti NJ, Loncle C, Calvo E, Turrini O, Iovanna JL, Tomasini R, Vasseur S. Strengthened glycolysis under hypoxia supports tumor symbiosis and hexosamine biosynthesis in pancreatic adenocarcinoma. Proceedings of the National Academy of Sciences of the United States of America. 2013;110:3919–3924. - PMC - PubMed
    1. Warburg O. On the origin of cancer cells. Science. 1956;123:309–314. - PubMed
    1. Chiarugi A, Dolle C, Felici R, Ziegler M. The NAD metabolome–a key determinant of cancer cell biology. Nature reviews Cancer. 2012;12:741–752. - PubMed

MeSH terms

Substances