. 2016 Aug 11;536(7615):210-4.
doi: 10.1038/nature19058. Epub 2016 Jul 27.

A trans-synaptic nanocolumn aligns neurotransmitter release to receptors

A trans-synaptic nanocolumn aligns neurotransmitter release to receptors

Ai-Hui Tang et al. Nature. .

Abstract

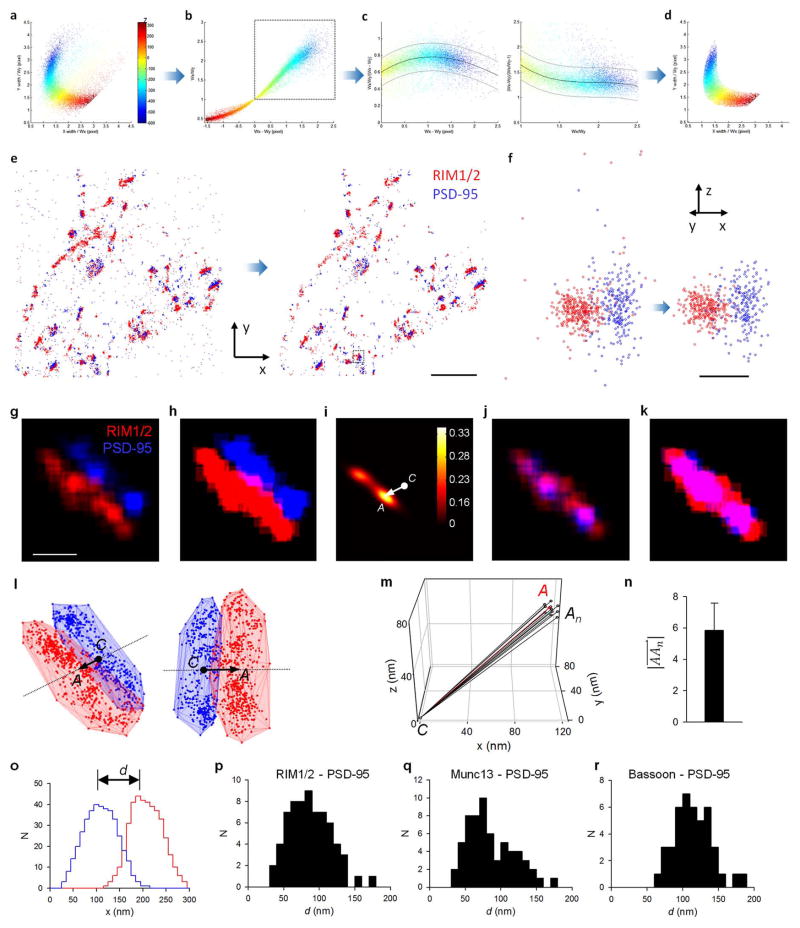
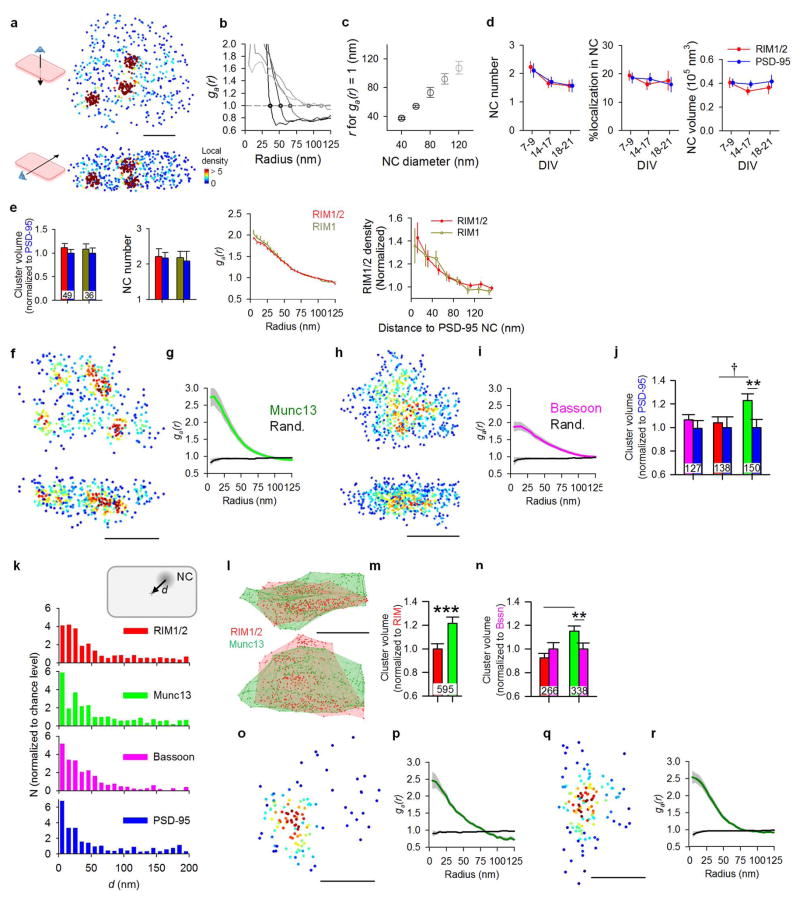
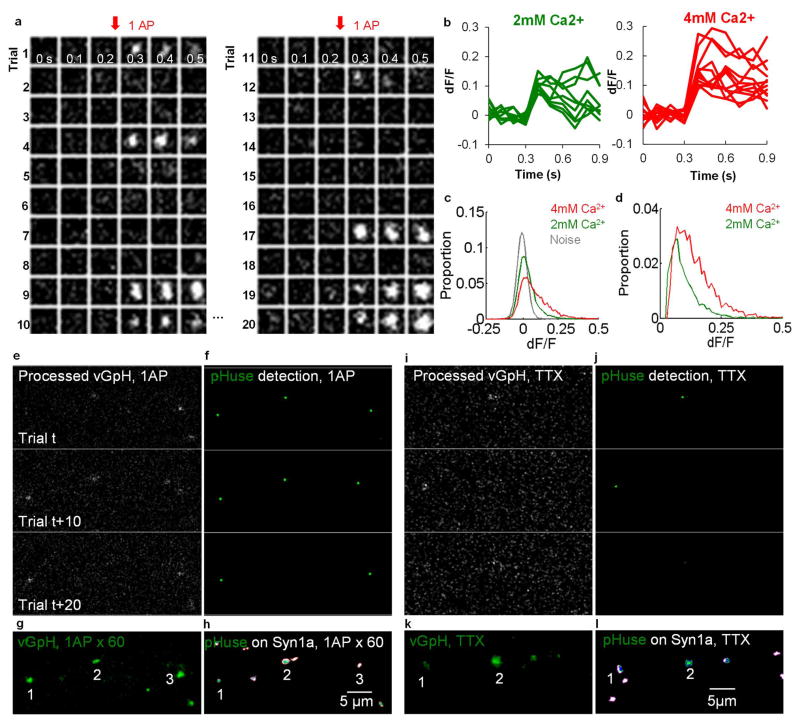
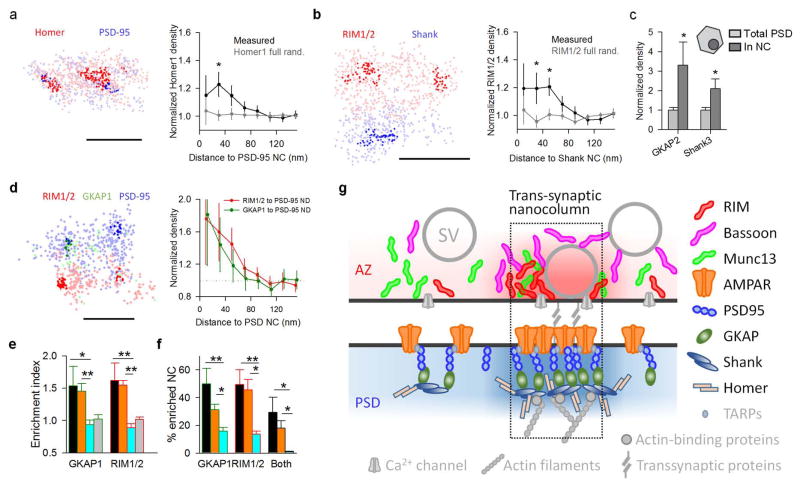
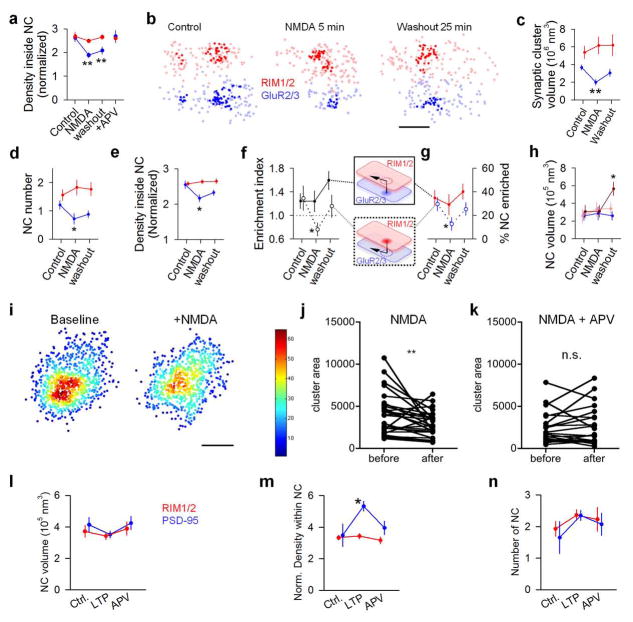
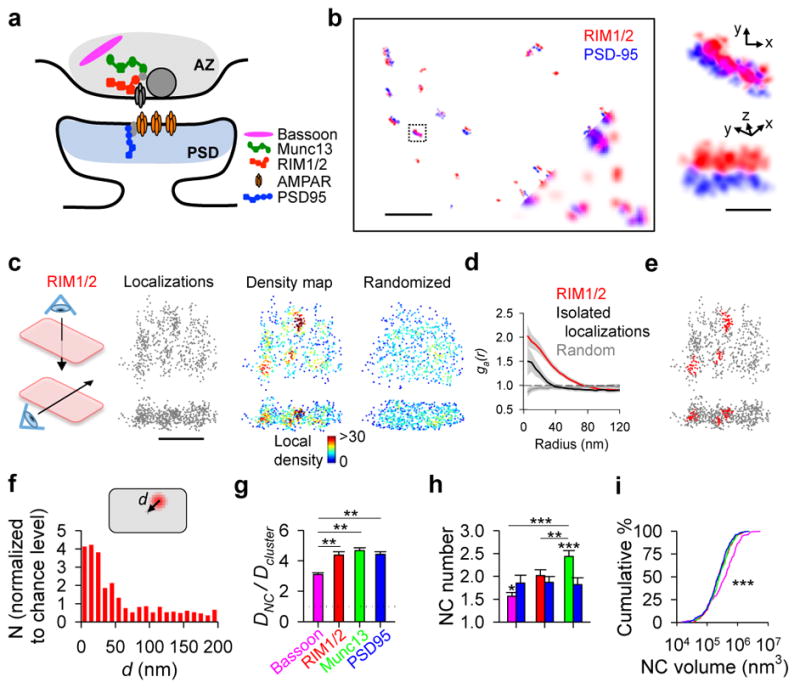
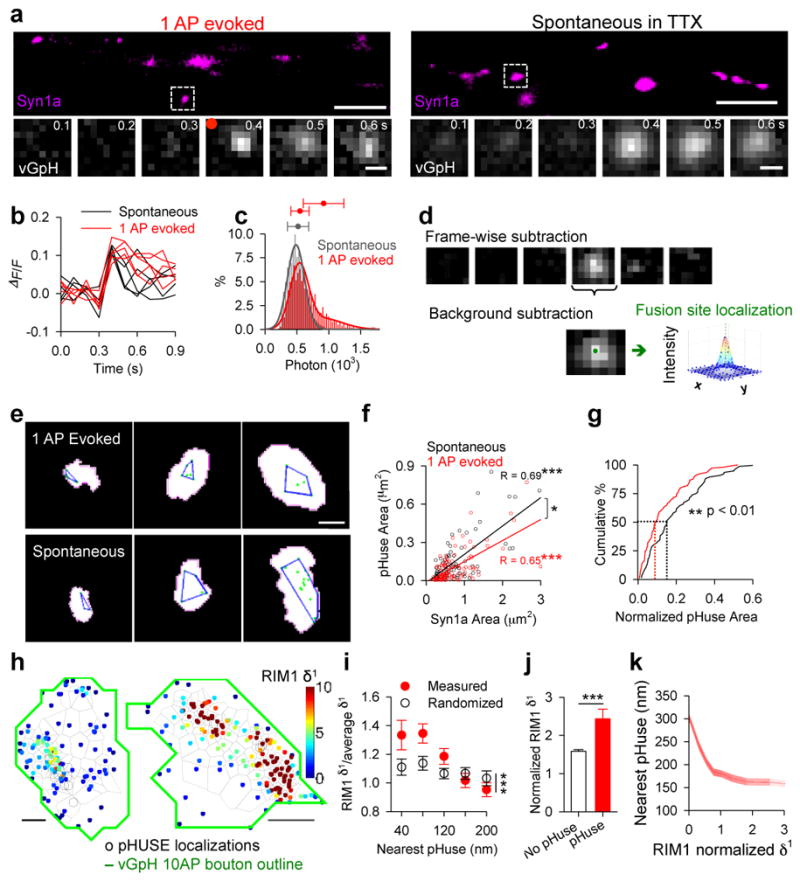
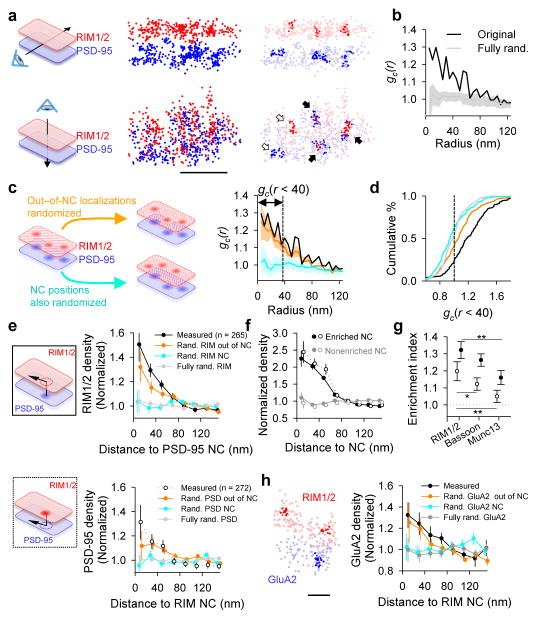
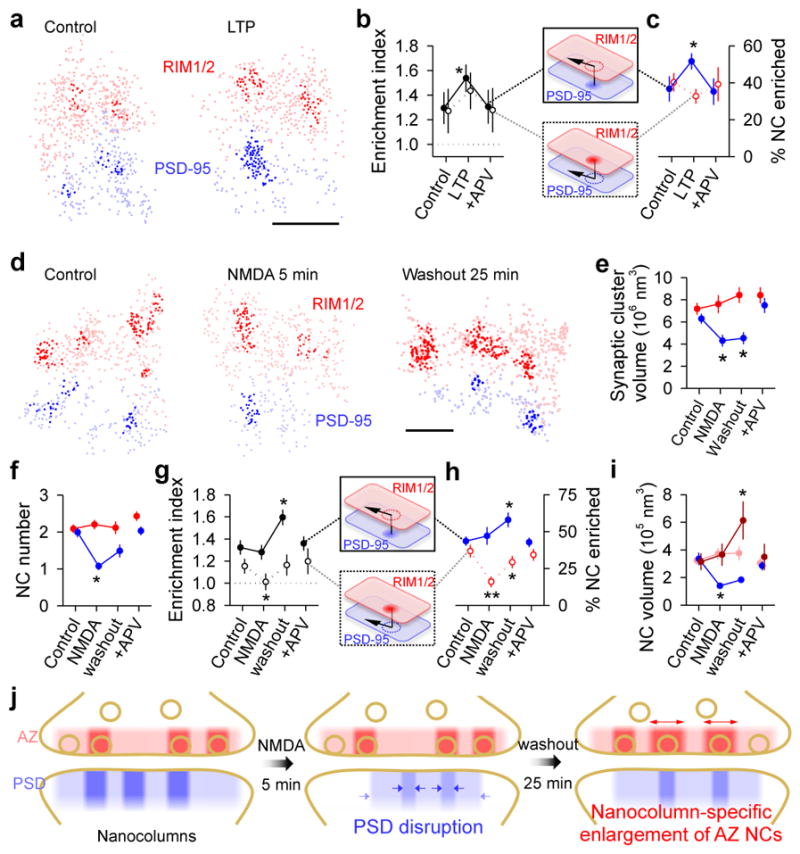
Synaptic transmission is maintained by a delicate, sub-synaptic molecular architecture, and even mild alterations in synapse structure drive functional changes during experience-dependent plasticity and pathological disorders. Key to this architecture is how the distribution of presynaptic vesicle fusion sites corresponds to the position of receptors in the postsynaptic density. However, while it has long been recognized that this spatial relationship modulates synaptic strength, it has not been precisely described, owing in part to the limited resolution of light microscopy. Using localization microscopy, here we show that key proteins mediating vesicle priming and fusion are mutually co-enriched within nanometre-scale subregions of the presynaptic active zone. Through development of a new method to map vesicle fusion positions within single synapses in cultured rat hippocampal neurons, we find that action-potential-evoked fusion is guided by this protein gradient and occurs preferentially in confined areas with higher local density of Rab3-interacting molecule (RIM) within the active zones. These presynaptic RIM nanoclusters closely align with concentrated postsynaptic receptors and scaffolding proteins, suggesting the existence of a trans-synaptic molecular 'nanocolumn'. Thus, we propose that the nanoarchitecture of the active zone directs action-potential-evoked vesicle fusion to occur preferentially at sites directly opposing postsynaptic receptor-scaffold ensembles. Remarkably, NMDA receptor activation triggered distinct phases of plasticity in which postsynaptic reorganization was followed by trans-synaptic nanoscale realignment. This architecture suggests a simple organizational principle of central nervous system synapses to maintain and modulate synaptic efficiency.


Conflict of interest statement

The authors declare no competing financial interests.

Figures

Extended Data Figure 1
Extended Data Figure 1. Filtering of localizations and automatic algorithm to detect the synaptic axis
a, Scatterplot of fitted peak width in y (Wy) against that in x (Wx). The color codes the position in z. All localizations away from this center dense region arise from multiple overlapping or poorly fitted peaks and should be rejected. b, The ellipticity (Wx/Wy) and the width difference (WxWy) formed an approximate linear relationship when Wx > Wy (dotted box). c, We fitted the ratios between ellipticity and the width difference to the denominators with third degree polynomial functions (black line) and rejected all localizations out of 95% confidence intervals (gray lines) of the curve (> 1.96 × standard deviation). The same criteria was applied to the other fraction of localizations with Wx < Wy. d, The same scatterplot as in a after rejection of all of the diffuse localizations (about 20–25%). e–f, The filtering protocol cleared up most of the localizations from multiple overlapping peaks or poorly fitted peaks, including most of the nonrelevant background localizations (e, scale 2 μm) and those localizations with poorly calibrated z positions (f, scale 200 nm). The synapse in f corresponds to the boxed synapse in e. g, A 2D section through the center of the convoluted constructed 3D distribution matrix of a synapse. h, Peak density of the matrix set to a quarter of the mean molecule density of the synaptic cluster. i, 2D section at the same position of the 3D matrix of direct cross-correlation of the two channels (equation 3 in methods). C is the center of matrix, and A is the peak of the cross-correlation. j–k, Best overlap of the two synaptic clusters after PSD-95 was moved in 3D space along the vector CA. l, 3D scatter plots of the synapse in two different view angles. The arrow denotes the vector and the extended line (dotted) represents the synaptic axis. m, 3D plot of detected synaptic axis when the positions of high density peaks in RIM1/2 (nanoclusters) were randomized within the synaptic cluster. This simulation was performed 35 times, but only 10 representative results are presented here to avoid overlapping. The red denotes the synaptic axis of the original synaptic cluster. n, Averaged distance between the detected Cn positions from 35 simulated clusters to the C position of the original cluster. Data shown in mean ± s.d. This < 6 nm distance confirms that the high density peaks have negligible effect on the detection of the synaptic axis in this method. o, Distribution of all localizations along the synaptic axis with bin size of 10 nm. Peak-to-peak distance between the synaptic protein pair can be measured from this distribution. p–r, Distribution of peak-to-peak distances for three pairs of synaptic proteins.
Extended Data Figure 2
Extended Data Figure 2. Nanocluster organization of vesicle release machinery proteins in the active zone and postsynaptic AMPA receptors
a, En-face (top) and side (bottom) views of local density maps of a simulated synapse with artificial NCs with 40 nm diameters, scale 100 nm. b, Autocorrelation function of simulated clusters with different sized NCs. The points represent the radius where g(r) = 1. c, Pooled data from 15 sets of simulations showing that the radius where g(r) first crosses 1 reasonably estimates the average NC diameters. d, Comparison of NC number, fraction of localization in NC, and NC volume across different developmental stages shows no significant difference, though the young DIV9 culture shows a trend toward increased NC numbers (one-way ANOVA on ranks for NC number and volume, one-way ANOVA for %localization in NC). Data were from 143 RIM NCs and 135 PSD NCs of 64 DIV9 synapses, 63 RIM NCs and 65 PSD NCs of 38 DIV14 synapses, and 44 RIM NCs and 41 PSD NCs from 28 DIV21 synapses. e, Comparison of two RIM antibodies (from left to right) in whole synaptic cluster volume, number of NCs, autocorrelation function estimating average NC diameter, and protein density relative to PSD-95 NC centers. Anti-RIM1/2 (Synaptic Systems #140–203) targets the Zn-finger domain and anti-RIM1 targets the PDZ domain of RIM1 (Synaptic Systems #140–003). These tests suggest that there is no significant difference between these two antibodies. The numbers in bars denote the group sizes. f, Local density maps of en-face (top) and side (bottom) views of an example Munc13 cluster, scale 200 nm. g, Auto-correlation functions for Munc13 distributions compared to simulated randomized distributions. h–i, Local density maps and ACF of Bassoon cluster, scale 200 nm. j, Pooled cluster volumes, normalized to PSD-95 volumes within each synapse. Each bar pair represents data from a set of RIM1/2-PSD-95, Munc13-PSD-95 or Bassoon-PSD-95 staining. The numbers in bars denote the group sizes. k, Distribution of en-face distances between NC center and synapse center. Data were normalized to the distribution of simulated clusters with the same number of NCs as the original synapse but randomized positions. l, An example synapse with RIM1/2 and Munc13 staining of the same synapse, shown in two different angles. The translucent surfaces represent the alpha shapes that define the synaptic cluster borders. m, Pooled RIM1/2 and Munc13 cluster volumes, normalized to RIM1/2 within each synapse. n, Pooled RIM1/2, Munc13 and Bassoon cluster volumes from staining of RIM1/2-Bassoon and Munc13-Bassoon, normalized to Bassoon within each synapse. *p<0.05, ***p<0.001, Wilcoxon signed-rank test. †p<0.05, one-way ANOVA on ranks with pairwise comparison procedures (Dunn’s method). o, Local density map of a GluA2 cluster. p, Auto-correlation functions for GluA2 distributions compared to simulated randomized distributions. q, Local density map of a GluR2/3 cluster. r, Auto-correlation functions for GluR2/3 distributions compared to simulated randomized distributions.
Extended Data Figure 3
Extended Data Figure 3. Detected nanoclusters unlikely due to labeling artifact or overcounting of molecules
a–i, Comparison of PSD-95 labeled with monoclonal primary antibodies directly conjugated to Alexa 647 dye (1°-A647, red) with the same molecules labeled with primary and secondary antibodies conjugated to Cy3 (1°-2°-Cy3, blue) as represented in c. a–b, Comparison between non-synaptic small groups of localizations arising from isolated primary antibodies and secondary antibodies. Schematic shown in (a). Standard deviation of localizations in both groups along different dimensions (n = 32 for A647; n = 36 for Cy3) in (b). The two types of localizations groups showed similar variation in all dimensions. d, Local density maps of the same PSD-95 cluster labeled with 1°-A647 (top) and 1°-2°-Cy3 (middle) and overlapped distribution of 1°-A647 and 2°-Cy3 with detected nanoclusters highlighted in darker colors (bottom), scale 200 nm. e, Autocorrelation of synaptic clusters labeled with 1°-A647 and 1°-2°-Cy3. f, Autocorrelation of isolated small groups of localizations of A647 and Cy3 dyes. g, Comparison of the radius at which the autocorrelation function crossed with the random level (g(r) = 1). There was no difference between PSD-95 clusters with different labeling methods, but the r(0) for isolated localization groups were significantly less than r(0) for PSD-95 clusters. . **p < 0.01, t-test between the filled and open bars of the same color. h, NCs detected in both channels displayed no difference in number, volume, or the fraction of NCs enriched with localizations from the other channel. i, Protein enrichment of localizations detected in each channels with those in the other channel (n = 32 synapses). These results demonstrate that the NCs we detected in our study were not due to aggregation of multiple secondary antibodies to the primary antibodies. j–r, Cells transfected with knockdown-rescue-PSD-95-GFP were labeled with nanobodies against GFP conjugated at a 1:1 ratio with Atto647 (Nb-At647, red) and primary/secondary antibodies against PSD-95 (1°-2°-Cy3, blue) as depicted in l. j–k, Comparison between non-synaptic small groups of localizations arising from isolated Nb-At647 and 1°-2°-Cy3 (as depicted in j, n = 26 and 28, respectively). k, The nanobodies showed a significant smaller size than antibodies. ***p < 0.001, two-way ANOVA, †p<0.05, ††p<0.01, pairwise comparison (Tukey Test) between nanobodies and antibodies. m–r, Similar comparison as in d–i between PSD-95 clusters labeled with Nb-At647 and 1°-2°-Cy3 (n = 13 synapses). Scale 200 nm. Overall, these results demonstrated that the NCs we detected in our study were unlikely due to artifacts of antibody binding and labeling. The difference between the size of the isolated localizations groups and PSD-95 clusters calculated by autocorrelation also argues against the possibility that the nanoclusters we detected were due to repetitive switching of one or a few fluorophores. **p < 0.01, t-test between the filled and open bars of the same color. s, An example synapse with nanoclusters highlighted before (upper) and after (lower) removal of localizations resulting from fluorophores lasting for multiple frames, scale 100 nm. t, Paired autocorrelation function of synaptic clusters with and without multiple-frame molecules. p = 0.77, n = 25 synapses for RIM1/2; p = 0.58, n = 25 synapses for PSD-95, two-way ANOVA with repeated measures. u, The tracking removed 13 ± 8% and 17 ± 9% of the localizations for RIM1/2 and PSD-95, respectively, but had no significant effects on autocorrelation function results, NC numbers, or NC volumes. ** p < 0.01, *** p < 0.001, NS p > 0.05, Wilcoxon signed-rank test.
Extended Data Figure 4
Extended Data Figure 4. 1AP evoked release is [Ca2+] dependent and mainly univesicular
a, Example of fluorescence signals at a single bouton over repeated trials of 1 AP stimulation. b, Single event traces of vGpH fluorescence increase following 1 AP stimuli in standard (2 mM) or heightened extracellular [Ca2+] (4 mM). c, Comparison of distributions of fluorescence changes in 2 mM (n = 233/27) and 4 mM (n = 115/12) extracellular [Ca2+], relative to noise distributions obtained from the baseline frames prior to stimulation. d, Comparison of noise-subtracted distributions of fluorescence changes in different [Ca2+]. e, Processed images of vGpH fluorescence increase following 1 AP stimuli from 3 trials 10 trials apart. f, Automatic detection using pHuse of events shown in e. g, Summed projection of framewise and background subtracted vGpH fluorescence increases over 60 trials. h, pHuse localizations on Syn1a (white). i–l. Same as eh for spontaneous events in TTX over 5 minutes. n given in synapses/experiments.
Extended Data Figure 5
Extended Data Figure 5. pHuse reveals differences between evoked and spontaneous fusion site areas
a. Comparison of spontaneous frequency measured presynaptically using vGpH (n = 77/22) and postsynaptically using GCaMP6f (n = 61/5), t = 1.02, n.s. b. Average bouton areas across groups, t = 0.87, n.s. c. Cumulative distributions of fusion areas for spontaneous and evoked release (K–S test, D = 0.23*) d. Cumulative distributions of normalized fusion areas for 1 AP evoked fusion excluding events with photon counts > mean + 2SD of spontaneous events (n = 91/27) compared to all evoked events (n = 104/28, K–S test, D = 0.05, n.s.) and spontaneous events (n = 77/22, K–S test, D = 0.25*) e–f. Interestingly, while evoked Pr was significantly positively correlated with Syn1a area, as reported previously, spontaneous event frequency showed no relationship with Syn1a area (e, linear fit, evoked R = 0.30**, spontaneous R = 0.12, n.s.). On the other hand, both spontaneous event frequency and evoked Pr significantly positively correlated with pHuse area (f, linear fit, evoked R = 0.64***, spontaneous R = 0.60***). This suggests that pHuse area may be a better approximate for AZ area and the functional parameters of a synapse than bouton area. g. Normalized pHuse area as a function of cell age shows no significant correlation (evoked R = 0.03, n.s., spont R = 0.004, n.s.). e–g: nevoked = 104/28, nspont = 77/22. h. Normalized pHuse area was not significantly different at RT (nevoked = 51/10, nspont = 32/7) vs physiological temperature (nevoked = 35/9, nspont = 34/4) within modes of release but still significantly different between modes of release. i. Normalized pHuse area was not significantly different at different thresholds for Syn1a within modes of release but still significantly different between modes of release (n = 51/10). j. Both numbers of events and mode of release are significant factors for pHuse area, but they do not have a significant interaction nevoked = 155/38, nspont = 109/29. (For i–j, see Supplementary Tables for statistics.) n given in synapses/experiments, n.s. = not significant, *p < 0.05, **p < 0.01, ***p < 0.001.
Extended Data Figure 6
Extended Data Figure 6. RIM1-mEos3.1 PALM identifies NCs
a. Neurons coexpressing RIM1-mVenus (a generous gift from Pascal Kaesar) and Syn1a-CFP colocalize to the same boutons. Right panels show enlargement of areas within the white boxes, scale 5 μm (left) and 1 μm (right). b. Neurons expressing RIM1-mVenus immunostained for RIM1/2 and Bassoon. Arrowheads point to some colocalized AZs, scale 2 μm. c. Immunofluorescence intensity of transfected cells normalized to nearby untransfected cells show 3.74 ± 0.11-fold overexpression of RIM and 1.24 ± 0.03-fold increase in Bassoon (n = 262 synapses/7 cells). d. Photon count distribution of RIM1-mEos3.1 (3997 localizations). e. Same boutons shown in Fig. 2 visualized using 5 × Nearest Neighbor Density (NND) as a measure of local density. f–h. Cumulative distributions of PALMed RIM1 NCs diameter, area, and number, respectfully, identified using adapted Tesseler analysis and 5 × NND analysis (n = 65/13). i. RIM1 localization density as a function of radial distance from pHuse localizations. (See Supplementary Tables for statistics.) j. Mean distance from pHuse localizations as a function of local density measured by 5 × NND (Raw data R = 0.23***, n = 26/13). k. Proportion of pHuse localizations within 40 nm of a RIM1 localization as a function of RIM1 local density measured by 5 × NND (R = 0.35***). n given in synapses/experiments unless otherwise specified, ***p < 0.001.
Extended Data Figure 7
Extended Data Figure 7. Protein enrichment within nanocolumns
a, Enrichment index between RIM1/2 and PSD-95. The left insets are replicas of Fig. 3e, and the enrichment index is defined as the average of the first three bins in the enrichment profile (boxed), i.e. normalized localization density within 60 nm from the projection center of a given NC. Filled points show RIM1/2 relative to PSD-95 NCs, open points show PSD-95 relative to RIM1/2 NCs. Same randomizations as in Fig. 3e and depicted again in b. **p<0.01, ***p<0.001, one-way ANOVA on ranks with pairwise comparison procedures (Dunn’s method). b, The fraction of enriched NCs is significantly above chance level, and is also dependent on the relative position of the two sets of NCs. c–d, Side and en-face views of a synaptic Munc13 and PSD-95 pair and a synaptic Bassoon and PSD-95 pair with highlighted nanoclusters, scale 200 nm. e, Pooled enrichment index of three AZ proteins and PSD-95, scale 200 nm. Filled points show AZ proteins relative to PSD-95 NCs, open points show PSD-95 relative to AZ protein NCs. **p<0.01, ***p<0.001, one-way ANOVA on ranks with pairwise comparison procedures (Dunn’s method). f, Example of RIM1/2 and PSD-95 in adult hippocampal slices. g, Auto-correlation functions of RIM1/2 and PSD-95 (n = 192 and 43 synapses, respectively). There were, on average, 2.02 ± 0.08 and 1.32 ± 0.21 NCs with a volume of (3.6 ± 0.2) and (4.2 ± 0.7) × 105 nm3 for RIM1/2 and PSD-95, respectively. Except PSD NC number which was significantly less than that in cultures (p = 0.03), all other parameters were similar (Wilcoxon signed-rank test). h, Enrichment profile between RIM1/2 and PSD-95 in tissue slices (28 synapses from 7 sections, 4 animals). *p<0.05 between measured and randomized synapses, two way ANOVA with pairwise comparison procedures (Dunn’s method).
Extended Data Figure 8
Extended Data Figure 8. Preferential release in nanocolumns can increase synaptic strength
a, Schematic of the experimentally constrained, deterministic approach used to study the dependence of synaptic strength on the spatial distribution of release sites and AMPARs. The simulated release site distribution at a synapse was drawn from its measured RIM positions and the average measured relationship between RIM density and pHuse locations (Fig 2). b, Distributions of measured RIM localizations within a single active zone (AZ) boundary (grey), and the same cluster with randomized positions of the indicated subsets of molecules. c, Maps of RIM local density normalized to the overall densities within the AZs. d, Probability density maps of possible release sites given that a release occurs. e, Distributions of GluA2/3 locations within the PSD boundary (grey) of the same measured synapse (ellipses refer to this distribution) and randomized. f, Maps of fraction of open channels at peak response per average release from the respective AZs directly above them in d. g, Calculated open channels at peak response, n = 20 randomly generated molecular distributions. See methods for more details.
Extended Data Figure 9
Extended Data Figure 9. Enrichment of other scaffolding proteins within nanocolumns
a, Enrichment of Homer1 with PSD-95 NCs, n = 118 NCs from 48 synapses, scale 100 nm. b, Enrichment of RIM1/2 to Shank NCs, n = 80 NCs from 32 synapses, scale 200 nm. *p<0.05, ANOVA on ranks with pairwise comparison procedures (Dunn’s method) in a and b. c, GKAP2 and Shank3 densities (determined with STORM, n = 6 and 12, respectively) within PSD-95 NCs (determined with PALM of transfected knockdown-replacement-PSD-95-mEos2) normalized to total PSD densities. Both proteins showed significant enrichment in PSD-95 NCs, *p<0.05, paired t-tests. d, Three-color STORM imaging of RIM1/2, GKAP1 and PSD-95 on the same synapses example (left) and protein enrichment profiles of RIM1/2 and GKAP1 with respect to PSD-95 NCs (right), n = 32 NCs from 17 synapses, scale 200 nm. e, Enrichment indices of RIM1/2 and GKAP1 relative to PSD-95 NCs. Color-coded bars represent the same set of randomizations as performed in Fig. 3c: orange denotes randomization of only out-of-NC localizations, cyan denotes randomization of NC positions within synaptic clusters and grey denotes randomization of all localizations. f, The percentage of PSD-95 NCs that were enriched with GKAP1, RIM1/2 or both with color-coded randomizations. *p<0.05, **p<0.01, ANOVA on ranks with pairwise comparison procedures (Dunn’s method), n = 32 NCs from 17 synapses in 7 different cultures. g, Schematic summary of the distribution of synaptic proteins within nanocolumns. The distributions of color-coded proteins are based on our results and the proteins in grey are hypothetical, some, such as Ca2+ channels, have been suggested previously to be clustered,.
Extended Data Figure 10
Extended Data Figure 10. Plasticity within nanocolumns
a, Changes in the localization density within RIM1/2 (red) and PSD-95 (blue) NCs under control, 5 min NMDA treatment, 25 min washout, and NMDA + APV treatment conditions. b–h, Reorganization of RIM1/2 and GluR2/3 under control, 5 min NMDA treatment, 25 min washout conditions examples (b), comparison of whole synaptic cluster sizes (c), NC number per synapse (d), localization density within NCs (e), enrichment indices (f), percentage of NCs that were enriched (g), and NC volumes (h). Note that similar to the results from the RIM1/2-PSD-95 analyses, only those RIM1/2 NCs that were enriched with GluR2/3 (dark red) were increased in volume. *p<0.05, **p<0.01, ANOVA on ranks with pairwise comparison to control group (Dunn’s method), and χ2 test for the proportion. Data from 62, 21 and 37 NCs from 34, 18 and 24 synapses for control, NMDA, and washout, respectively. i, Color coded local density map of an example live-PALMed PSD-95 cluster before and after NMDA treatment. Scale 100 nm. j–k, Changes in PSD-95 NC area induced by NMDA and blocked by APV (n = 28 and 21, respectively). **p<0.01, n.s. = not significant, paired t-test. l–n, LTP stimulation induced changes in NC volumes (l), localization density within NCs (m) and NC numbers (n). *p<0.05, ANOVA on ranks with pairwise comparison to control group (Dunn’s method).
Figure 1
Figure 1. Vesicle release proteins form subsynaptic nanoclusters
a, Color-coded schematic of studied synaptic proteins. b, Synapses labeled with RIM1/2 and PSD-95 imaged using 3D-STORM (10 nm pixels) compared to wide-field composite (bottom corner, 100 nm pixels), scale 2 μm. Boxed synapse enlarged in original (top) and rotated (bottom) angles, scale 200 nm. c, En-face (top) and side (bottom) views of a RIM1/2 cluster showing all localizations and local density maps for a measured synaptic cluster compared to a simulated randomized cluster, scale 200 nm. d, Auto-correlation functions of measured RIM1/2 (n = 115), isolated non-synaptic small groups of localizations due to repetitive switching of fluorophores (n = 42), and simulated randomized (n = 115) distributions. e, RIM1/2 nanoclusters (NCs, red) within a synaptic cluster. f, Distribution of NC distances from the center of synapses normalized to randomized distribution. g, Molecule density inside NCs normalized to synaptic average. h, Average number of protein NCs per synapse. i, Cumulative distributions of NC volumes. *p < 0.05, **p < 0.01, ***p < 0.001, One-way ANOVA on ranks with pairwise comparison procedures (Dunn’s method) for g–h and K–S test for i. All experiments were repeated ≥3 times. Also see Extended Data Fig. 3 and Supplementary Table 1.
Figure 2
Figure 2. Release site mapping by pHuse in single synapses shows RIM predicts evoked fusion distribution
a, Neurons co-expressing Syn1a-CFP (top, scale 5 μm), identifying synaptic boutons, and vGpH (bottom, scale 500 nm), used to detect vesicle fusion with fluorescence increases from 1 AP-evoked and spontaneous release. b, Example of fluorescence traces from evoked and spontaneous events over repeated trials at single boutons. c, Photon count distributions for detected spontaneous events fit with a normal distribution (μ = 512, σ = 167) and evoked events fit with a mixture of 2 normal distributions (μ1 = 542, σ1 = 143, μ2 = 912, σ2 = 319). Filled circles with error bars show μ ± σ of normal curves. d, Image processing steps in pHuse to determine fusion site locations. e, Fusion sites (green points) and area of fusion (blue line) from boutons of different sizes defined with Syn1a (white), scale 500 nm. f, Correlation between fusion area and bouton size, linear fit. Correlations are significantly different, ANCOVA, F1, 171 = 5.01. g, Cumulative distributions of fusion areas normalized to bouton size (K–S test, D=0.26**). f–g, nspontaneous = 77/22, nevoked = 104/28. h. Tessellated RIM1-mEos and pHuse localizations over the same boutons, scale 200 nm. i. Tesseler first-rank density (δ1) for RIM1 measured vs randomized distributions as a function of distance from pHuse localizations. j. Comparison within boutons of average δ1 for RIM1 localizations within 40 nm to a pHuse localization vs not. k. Average nearest pHuse distance as a function of RIM1 δ1. j–i, n = 26/13 *p < 0.05, **p < 0.01, ***p < 0.001. n given in synapses/experiments. All experiments were repeated ≥3 times. Also see Extended Data Figs. 4–6.
Figure 3
Figure 3. Transsynaptic nanoscale alignment of AZ and PSD proteins
a, Distributions of synaptic RIM1/2 and PSD-95 pair as the original localizations (left) and with NCs highlighted (right), scale 200 nm. Filled arrows indicate aligned NCs, open arrows non-aligned NCs. b, Paired correlation function (PCF) of measured RIM1/2 and PSD-95 compared to PCF with either distribution randomized. c, PCF of simulated distributions with (cyan) and without (orange) shuffling NC positions. d, Cumulative distributions of cross-correlation index (n = 143 synapses). e, RIM1/2 protein enrichment as a function of distance from translated PSD-95 NC centers (top, filled points) and PSD-95 enrichment relative to RIM1/2 NCs (bottom, open points). Simulations with same randomizations as in de were performed for each synapse. f, Protein density profile for enriched vs non-enriched NCs, n = 119 PSD-95 NCs, 90 RIM1/2 NCs. g, Enrichment indices for RIM1/2, Munc13, and Bassoon relative to PSD-95 NCs (filled) and for the opposite direction (open), n >260 NCs, *p < 0.05, **p< 0.01, ANOVA on ranks with Dunn’s method. h, GluA2 enrichment with respect to RIM1/2 NCs, n = 36 synapses, scale 100 nm. All experiments were repeated ≥3 times. Also see Extended Data Fig. 6 and Supplementary Table 2.
Figure 4
Figure 4. Retrograde plasticity of synaptic nanoscale alignment
a, Distributions of synaptic RIM1/2 and PSD-95 for control and post-LTP induction conditions with NCs highlighted. b–c, Across-condition comparison of enrichment index and percentage of NCs enriched (n = 45, 87 and 42 synapses for control, LTP, and APV, respectively). d, Distributions of RIM1/2 and PSD-95 for conditions following NMDA stimulation. Scale 100 nm. e–i, Across-conditions comparison of RIM1/2 and PSD-95. Dark red in i represents RIM1/2 NCs enriched with PSD-95 and light red the unenriched NCs. n = 61, 96, 77 and 74 synapses for control, NMDA, washout, and APV, respectively. j, Schematic summarizing the reorganization of NCs during NMDA-induced plasticity and recovery. *p < 0.05, **p < 0.01, ANOVA on ranks with pairwise comparison (Dunn’s method), and χ2 test for the proportion. All experiments were repeated ≥3 times.

Comment in

References

    1. Fromer M, et al. De novo mutations in schizophrenia implicate synaptic networks. Nature. 2014 - PMC - PubMed
    1. Volk L, Chiu SL, Sharma K, Huganir RL. Glutamate Synapses in Human Cognitive Disorders. Annu Rev Neurosci. 2015;38:127–149. - PubMed
    1. Franks KM, Stevens CF, Sejnowski TJ. Independent sources of quantal variability at single glutamatergic synapses. The Journal of Neuroscience. 2003;23:3186–3195. - PMC - PubMed
    1. MacGillavry HD, Song Y, Raghavachari S, Blanpied TA. Nanoscale Scaffolding Domains within the Postsynaptic Density Concentrate Synaptic AMPA Receptors. Neuron. 2013;78:615–622. - PMC - PubMed
    1. Nair D, et al. Super-resolution imaging reveals that AMPA receptors inside synapses are dynamically organized in nanodomains regulated by PSD95. The Journal of Neuroscience. 2013;33:13204–13224. - PMC - PubMed

Publication types