. 2016 Aug 30;7(35):56781-56797.
doi: 10.18632/oncotarget.10788.

Gene expression analysis of TIL rich HPV-driven head and neck tumors reveals a distinct B-cell signature when compared to HPV independent tumors

Affiliations

Gene expression analysis of TIL rich HPV-driven head and neck tumors reveals a distinct B-cell signature when compared to HPV independent tumors

Oliver Wood et al. Oncotarget. .

Abstract

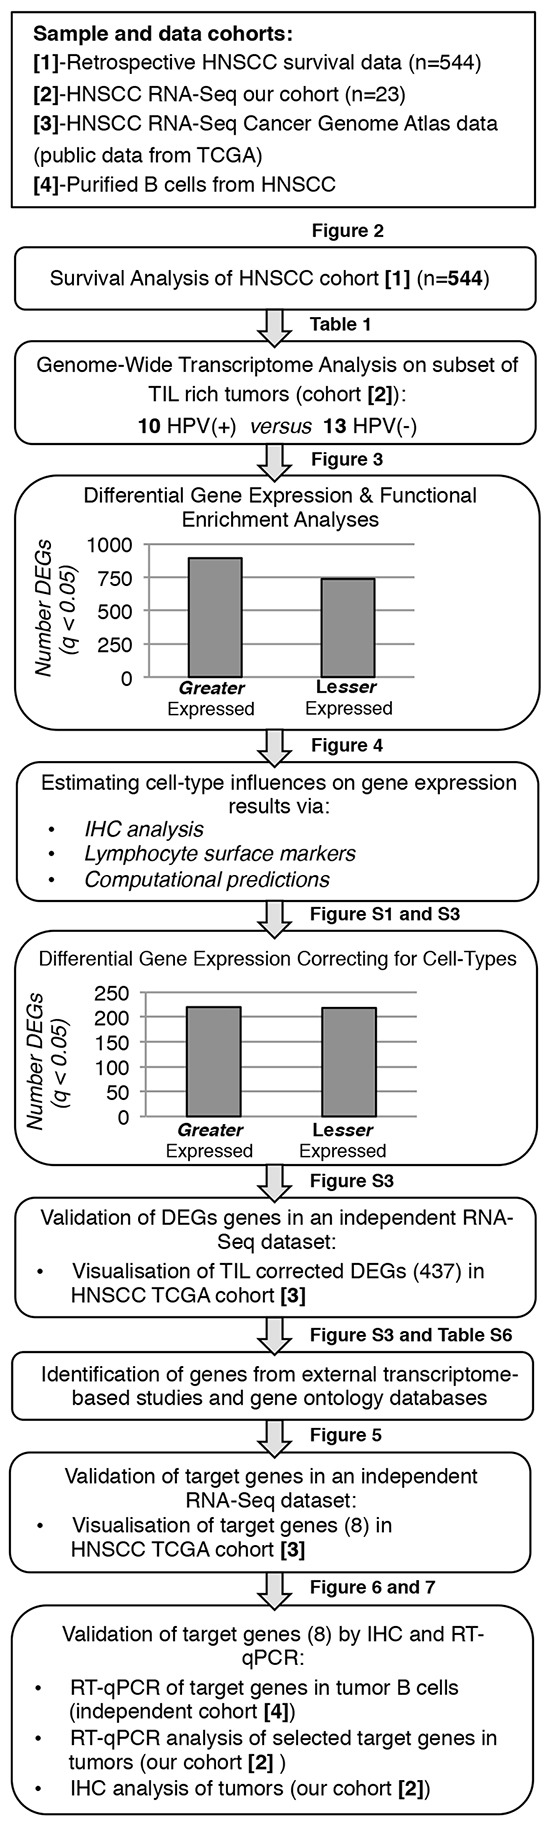
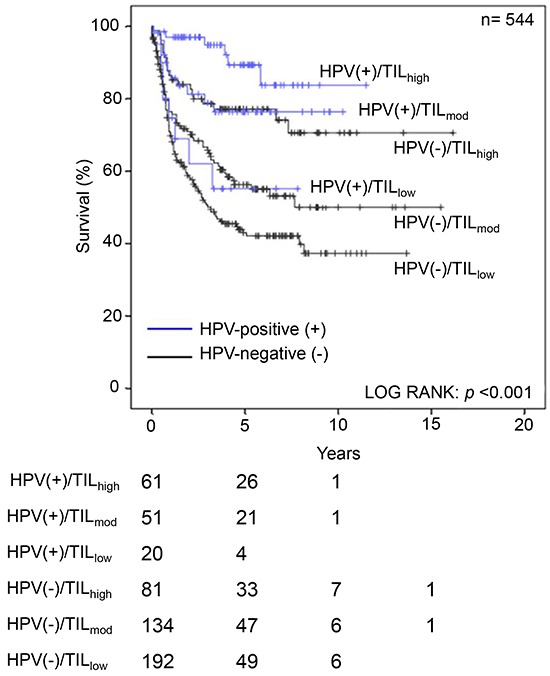
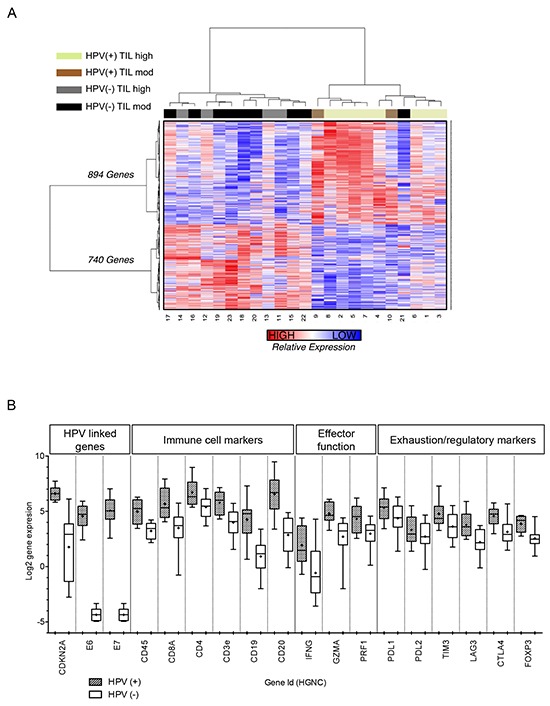
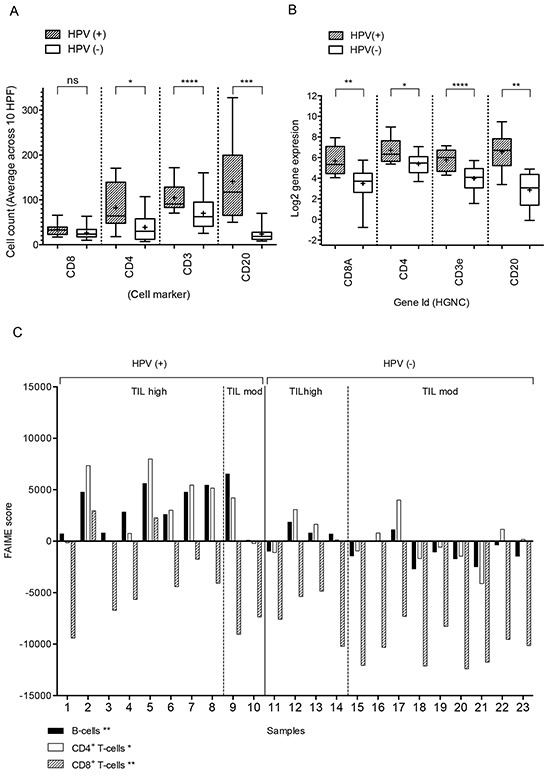
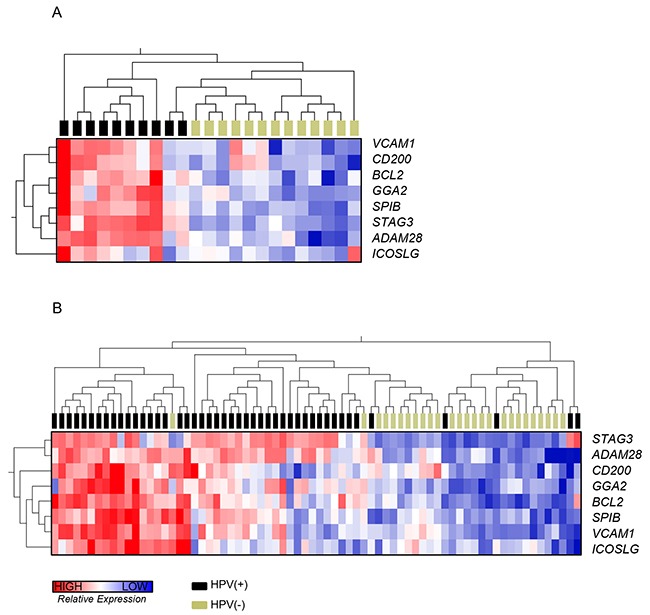
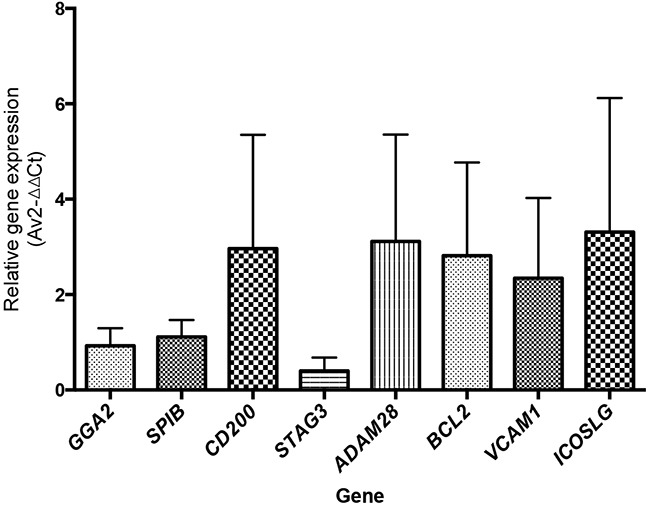
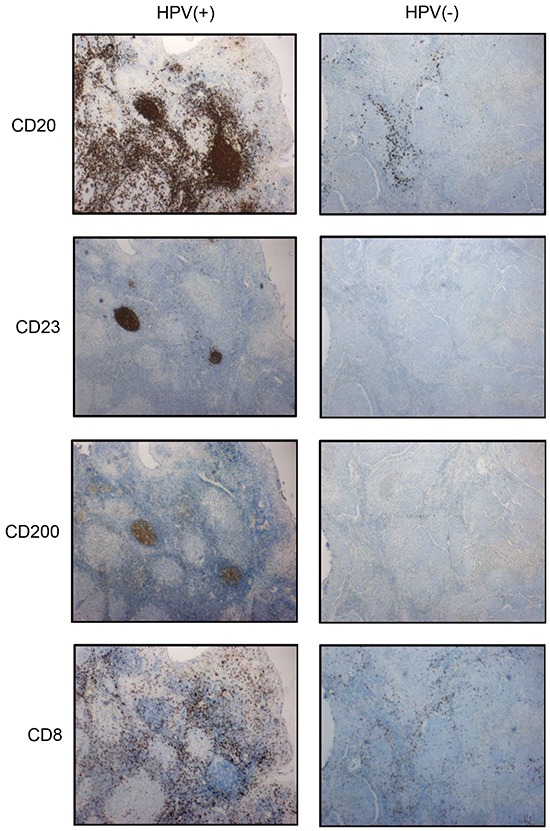
Human papilloma virus (HPV)-associated head and neck squamous cell carcinoma (HNSCC) has a better prognosis than it's HPV negative (HPV(-)) counterpart. This may be due to the higher numbers of tumor-infiltrating lymphocytes (TILs) in HPV positive (HPV(+)) tumors. RNA-Sequencing (RNA-Seq) was used to evaluate whether the differences in clinical behaviour simply reflect a numerical difference in TILs or whether there is a fundamental behavioural difference between TILs in these two settings. Thirty-nine HNSCC tumors were scored for TIL density by immunohistochemistry. After the removal of 16 TILlow tumors, RNA-Seq analysis was performed on 23 TILhigh/med tumors (HPV(+) n=10 and HPV(-) n=13). Using EdgeR, differentially expressed genes (DEG) were identified. Immune subset analysis was performed using Functional Analysis of Individual RNA-Seq/ Microarray Expression (FAIME) and immune gene RNA transcript count analysis. In total, 1,634 DEGs were identified, with a dominant immune signature observed in HPV(+) tumors. After normalizing the expression profiles to account for differences in B- and T-cell number, 437 significantly DEGs remained. A B-cell associated signature distinguished HPV(+) from HPV(-) tumors, and included the DEGs CD200, GGA2, ADAM28, STAG3, SPIB, VCAM1, BCL2 and ICOSLG; the immune signal relative to T-cells was qualitatively similar between TILs of both tumor cohorts. Our findings were validated and confirmed in two independent cohorts using TCGA data and tumor-infiltrating B-cells from additional HPV(+) HNSCC patients. A B-cell associated signal segregated tumors relative to HPV status. Our data suggests that the role of B-cells in the adaptive immune response to HPV(+) HNSCC requires re-assessment.

Keywords: RNA-sequencing; head and neck squamous cell carcinoma; human papilloma virus; transcriptome; tumor-infiltrating lymphocyte.


Conflict of interest statement

The authors declare no conflicts of interest.

Figures

Figure 1
Figure 1. Overview of experimental procedures and analysis used to evaluate TIL
Schematic representation of the multi-step analysis performed to understand the features of tumor-infiltrating immune cells in patients with HPV(+) and HPV(−) HNSCC.
Figure 2
Figure 2. Kaplan-Meier curves for HNSCC mortality stratified according to HPV status and TIL density
Survival of a retrospective cohort of HNSCC patients (n=544) with respect to HPV status and the density of immune cell infiltrate was assessed. TIL density predicts for outcome in both the HPV(+) and HPV(−) patients; log-rank test, p<0.001.
Figure 3
Figure 3. Differentially expressed genes between HPV(+) and HPV(−) tumors
A. a heatmap to illustrate the DEGs between HPV(+) and HPV(−) tumors; each row represents the z-score of normalized gene expression values for a given gene; each column represents the gene expression for a given tumor. Z-scores are calculated from the average gene expression, plus standard deviation, in all tumors for a given gene, this enables the relative comparison of gene expression between tumors; the scale of z-score is shown: red shading denotes greater gene expression, blue shading denotes lower gene expression. Hierarchical clustering of genes and tumors based on their expression profile is reflected in the dendrograms to the left and the top of the heatmap, respectively, and was performed by calculating distance using the Pearson's correlation metric and then clustering distance using the ward linkage method*. B. the expression of key genes associated with HPV, immune cell markers, immune effector function and immune exhaustion/regulation are displayed for HPV(+) and HPV(−) tumors as box plots (min/max) with the + representing the mean. A greater expression of immune associated genes is observed in HPV(+) tumors**. *Unsupervised clustering of gene expression data was normalized using the TMM method followed by variance stabilizing transformation of the TMM normalized data. **Gene expression data from the normalized transcript counts; data was normalized using the TMM method followed by variance stabilizing transformation of the TMM normalized data.
Figure 4
Figure 4. Immune cell subset analysis of HPV(+) and HPV(−) tumors
A. The distribution of CD4, CD8, CD3 and CD20-expressing cells in HPV(+) and HPV(−) tumors as detected by IHC; cell counts are given as a mean of 10 high-power fields. B. Gene expression of CD4, CD8A, CD3E and CD20 of HPV(+) and HPV(−) tumors displayed as box plots (min/max) with the + representing the mean*. Differences in TIL density between HPV(+) and HPV(−) tumors are observed both by gene expression profiling and IHC analysis. C. the FAIME score of lymphocytes in HPV(+) and HPV(−) tumors; the difference in distribution of specific cell subsets based on ranked gene expression is shown. Asterisks in column labels indicate a significance level of two-sample t-test comparisons of FAIME scores between HPV(+) and HPV(−) tumors: *P <0.05 and **P <0.01). *Gene expression data from the normalized transcript counts; data was normalized using the TMM method followed by variance stabilizing transformation of the TMM normalized data.
Figure 5
Figure 5. Expression of B-cell-associated genes by RNA-Seq
Heatmaps* to illustrate gene expression of the identified B-cell-associated genes between HPV(+) and (−) tumors: GGA2, SPIB, CD200, STAG3, ADAM28, BCL2, VCAM1 and ICOSLG. A., a heatmap of our HNSCC dataset (HPV(+) n=10 and HPV(−) n=13). B., a heatmap of the TCGA HNSCC dataset (HPV(+) n=46 and HPV(−) n=26); publically available data from anatomically matched tumors arising in the oropharynx, tonsil and base of tongue. In both datasets, tumors cluster according to HPV status, with a greater expression of the identified B-cell-associated genes in HPV(+) tumors. *Unsupervised clustering of gene expression data was normalized using the TMM method followed by variance stabilizing transformation of the TMM normalized data. Each row represents normalized gene expression values for a given gene; each column represents the gene expression for a given tumor: red shading denotes greater gene expression, blue shading denotes lower gene expression. Hierarchical clustering of genes and tumors based on their expression profile is reflected in the dendrograms to the left and the top of the heatmap, respectively, and was performed by calculating distance using the Pearson's correlation metric and then clustering distance using the ward linkage method.
Figure 6
Figure 6. Relative expression of B-cell-associated genes by RT-qPCR
The average relative gene expression of B-cell-associated genes was measured by RT-qPCR* in HPV(+) tumors. The expression of the B-cell-associated genes GGA2, SPIB, CD200, STAG3, ADAM28, BCL2, VCAM1 and ICOSLG was confirmed in B-cells sorted from an independent cohort of HPV(+) tumors (n=6). *Relative gene expression by RT-qPCR, calculated using the comparative Ct method with Actin as the control gene (2-ΔΔCt method) (23).
Figure 7
Figure 7. Expression of B-cell markers by IHC
Cell subset anlalysis by IHC for the B-cell markers CD20, CD23 and CD200, as well as the T-cell marker CD8, was performed on sequential sections for HPV(+) (n=9) and HPV(−) (n=13) tumors; representative data is shown for one tumor from each cohort. Pseudo-follicle formation is apparent in HPV(+) tumors along with dense infiltrate of CD20+ B-cells. TIL density was greater in HPV(+) tumors.

References

    1. Argiris A, Karamouzis MV, Raben D, Ferris RL. Head and neck cancer. Lancet. 2008;371:1695–1709. - PMC - PubMed
    1. Parkin DM, Bray F, Ferlay J, Pisani P. Global cancer statistics, 2002. CA Cancer J Clin. 2005;55:74–108. - PubMed
    1. Blot WJ, McLaughlin JK, Winn DM, Austin DF, Greenberg RS, Preston-Martin S, Bernstein L, Schoenberg JB, Stemhagen A, Fraumeni JF., Jr Smoking and drinking in relation to oral and pharyngeal cancer. Cancer research. 1988;48:3282–3287. - PubMed
    1. Chaturvedi AK, Engels EA, Anderson WF, Gillison ML. Incidence trends for human papillomavirus-related and -unrelated oral squamous cell carcinomas in the United States. Journal of clinical oncology. 2008;26:612–619. - PubMed
    1. Chaturvedi AK, Engels EA, Pfeiffer RM, Hernandez BY, Xiao W, Kim E, Jiang B, Goodman MT, Sibug-Saber M, Cozen W, Liu L, Lynch CF, Wentzensen N, Jordan RC, Altekruse S, Anderson WF, et al. Human papillomavirus and rising oropharyngeal cancer incidence in the United States. Journal of clinical oncology. 2011;29:4294–4301. - PMC - PubMed

MeSH terms