. 2016 Jul 27;11(7):e0158115.
doi: 10.1371/journal.pone.0158115. eCollection 2016.

Evaluating the Effectiveness of Wildlife Detection and Observation Technologies at a Solar Power Tower Facility

Affiliations

Evaluating the Effectiveness of Wildlife Detection and Observation Technologies at a Solar Power Tower Facility

Robert H Diehl et al. PLoS One. .

Abstract

Solar power towers produce electrical energy from sunlight at an industrial scale. Little is known about the effects of this technology on flying animals and few methods exist for automatically detecting or observing wildlife at solar towers and other tall anthropogenic structures. Smoking objects are sometimes observed co-occurring with reflected, concentrated light ("solar flux") in the airspace around solar towers, but the identity and origins of such objects can be difficult to determine. In this observational pilot study at the world's largest solar tower facility, we assessed the efficacy of using radar, surveillance video, and insect trapping to detect and observe animals flying near the towers. During site visits in May and September 2014, we monitored the airspace surrounding towers and observed insects, birds, and bats under a variety of environmental and operational conditions. We detected and broadly differentiated animals or objects moving through the airspace generally using radar and near solar towers using several video imaging methods. Video revealed what appeared to be mostly small insects burning in the solar flux. Also, we occasionally detected birds flying in the solar flux but could not accurately identify birds to species or the types of insects and small objects composing the vast majority of smoking targets. Insect trapping on the ground was somewhat effective at sampling smaller insects around the tower, and presence and abundance of insects in the traps generally trended with radar and video observations. Traps did not tend to sample the larger insects we sometimes observed flying in the solar flux or found dead on the ground beneath the towers. Some of the methods we tested (e.g., video surveillance) could be further assessed and potentially used to automatically detect and observe flying animals in the vicinity of solar towers to advance understanding about their effects on wildlife.


Conflict of interest statement

Competing Interests: The authors have declared that no competing interests exist.

Figures

Fig 1
Fig 1. Different views of a solar power tower facility.
Images of the solar power towers: A) Far view of a solar tower facility showing a foreground of mirror “heliostats” used to reflect sunlight toward the “receiver” towers (yellow arrows). B & C) Closer views (approximately 2 km and 400m away, respectively) of towers being lit with sunlight, as well as the machinery associated with power generation. D) Top of a solar power tower being heated by solar flux and multiple, small smoking objects in the closely surrounding airspace. For scale, the illuminated receiver (white rectangle) measures approximately 40 m in height and 15 m in width. Photos by Paul Cryan, USGS.
Fig 2
Fig 2. Aerial view of the solar facility where study was conducted.
Location of each solar concentrating tower is indicated in the aerial view of facility, along with radar locations and coverage (yellow dots and shaded circles). The inset shows an expanded view of the Tower 3 pad (all towers share same layout), with structures in shades of gray as well as the locations of the concentrating tower (yellow), insect traps (red), and camera location (blue).
Fig 3
Fig 3. Examples of radar-monitored airspace around a solar tower.
Sweeps of the radar at 0600 PDT (A) and 1100 PDT (B) on 16 May 2014 while operating near Tower 3. Range rings in green denote 250-m intervals out to 1,500 m. The radar is located in the center of the image and is surrounded by ground clutter caused primarily by the heliostat field. Tower 3 causes discernible clutter to the SSW and throughout a ~200° ring at about 1,000 m range. Flying animals, shown as yellow dots (most recent location) with blue tracks (previous locations), were nearly absent in the airspace at 06:00 (A) but occurred in large numbers by 11:00 (B), consistent with patterns observed daily (see text). An animation of (B) is available in S1 Video.
Fig 4
Fig 4. Setting up insect traps near a solar tower.
Showing: A) complete malaise trap set up with “top” portion resembling a tent that is suspended between two 3-m poles and attached funnel below; B) funnel trap only that is suspended above ground with 1-m poles affixed to each corner. Photo by Paul Cryan, USGS.
Fig 5
Fig 5. Number of radar biological target tracks.
Julian day 134 refers to 14 May, 245 refers to 2 September, and shading differentiates night (gray) and day as determined by local civil sunrise and sunset.
Fig 6
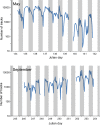
Fig 6. Variation in animal detections throughout the 24-hour day by radar in May (left) and September (right).
Top) The number of tracks associated with vertebrate-like targets (blue) and invertebrate-like targets (red) cumulated for each hour throughout the 24-hour cycle from 14–22 May 2014 and 3–11 September 2014. Points show the number of tracks associated with each hour summed across all days, and the loess fit with 95% confidence limits captures trends in the data. Bottom) The corresponding relative proportion of invertebrates with loess fit and 95% confidence limits. A darker horizontal line indicates the 0.5 proportion level.
Fig 7
Fig 7. Birds in thermal video imagery and corresponding views from other surveillance cameras.
Comparison of the thermal surveillance (TS) and wide dynamic range (WDR) cameras. Upper panel: still images from the TS (top row) and WDR (middle row) videos show a small bird near a solar tower over three consecutive seconds. Lower panel: still images from TS (left) and WDR far- (center) and near-view (right) videos showing the simultaneous detection of a medium-sized, falcon-like bird. Red circles in thermal frames show automatic target detection by processing software and green arrows show the corresponding bird in the WDR visual image.
Fig 8
Fig 8. Erratic flight of insect burning in solar flux.
Close-up view of what is presumed to be an insect smoking in the flux of a solar tower. Smoking objects often exhibit erratic flight trajectories, even in mostly windless conditions, suggesting powered flight. For perspective, the red object in the middle right of the scene is a light that measures approximately 12 cm in diameter and the smoking object is estimated to be 2–10 m above the light.
Fig 9
Fig 9. Burning insect imaged with different kinds of video cameras.
Single frame from the scientific-grade thermal (SGT) camera (left) and wide dynamic range (WDR) camera (right) showing the same burning insect (arrow) in the Tower 1 flux field at 08:45:35 on 6 September 2014. The tower is just out of the field of view to the right. The images are adjusted to the same spatial scale, and the ~1 m spatial reference is an estimate based on approximate line-of-sight range to the insect. Bright points in the SGT image represent other probable insects in or near the flux field. A dark region in the upper-right of the thermal image is the ‘ghost’ of a target that was in the frame when a non-uniformity correction was performed. An animation from the SGT that concludes in this frame is available in S9 Video.

Similar articles

Cited by

References

    1. McCrary MD, McKernan RL, Schreiber RW, Wagner WD, Sciarrotta TC. Avian mortality at a solar energy power plant. J Field Ornithol. 1986;57: 135–141.
    1. HT Harvey & Associates. Ivanpah Solar Electric Generating System Avian & Bat Monitoring Plan—2013–2014 Annual Report Nipton, CA: HT Harvey & Associates.
    1. Taylor P. Bird deaths at Calif. power plant a PR nightmare for industry. Environment & Energy Publishing, 19 Jan 2015. Available: http://www.eenews.net/greenwire/stories/1060011853. Accessed 18 May 2015.
    1. Cryan PM, Gorresen PM, Hein CD, Schirmacher MR, Diehl R, Huso MM, et al. Behavior of bats at wind turbines. Proceedings of the National Academy of Sciences. 2014;111: 15126–15131. - PMC - PubMed
    1. Larkin RP, Frase BA. Circular paths of birds flying near a broadcasting tower in cloud. J Comp Psychol. 1988;102: 90–93.

LinkOut - more resources