. 2016 Nov 15;7(46):74658-74677.
doi: 10.18632/oncotarget.10813.

Rapamycin ameliorates chitosan nanoparticle-induced developmental defects of preimplantation embryos in mice

Affiliations

Rapamycin ameliorates chitosan nanoparticle-induced developmental defects of preimplantation embryos in mice

Yun-Jung Choi et al. Oncotarget. .

Abstract

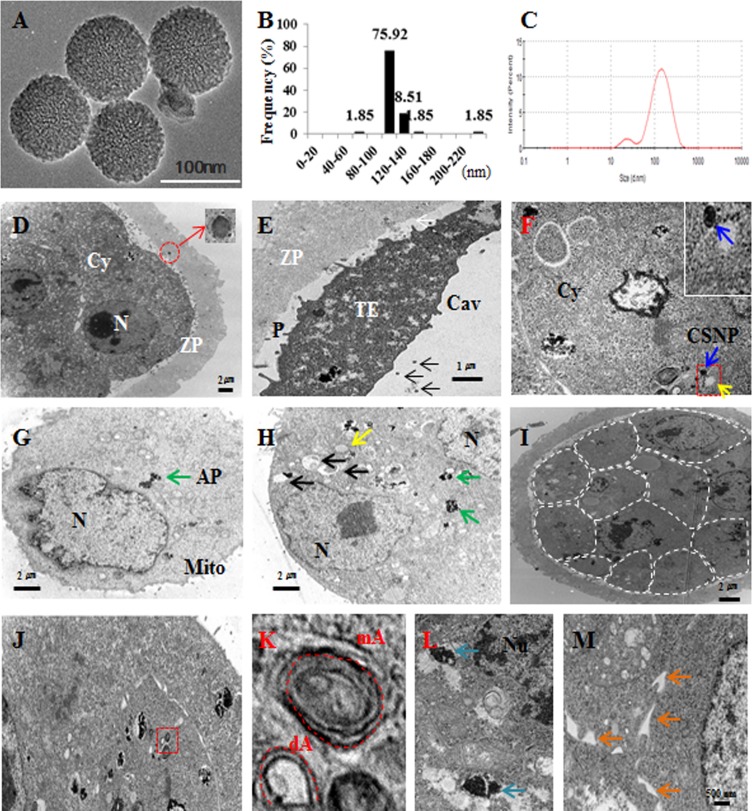
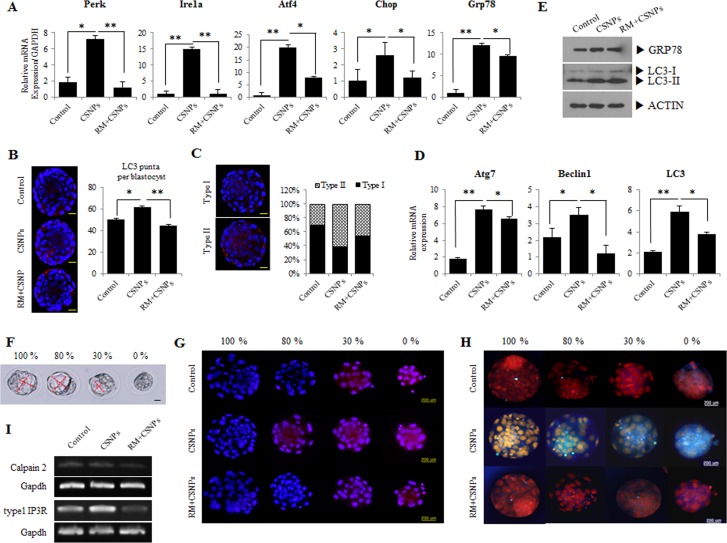
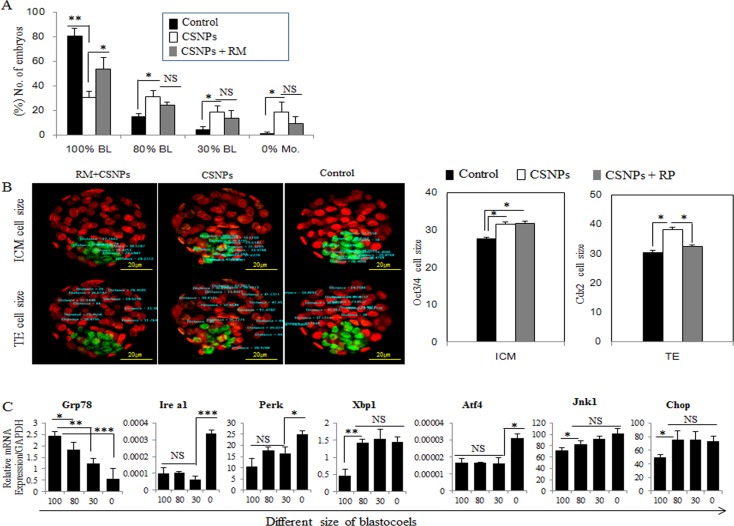
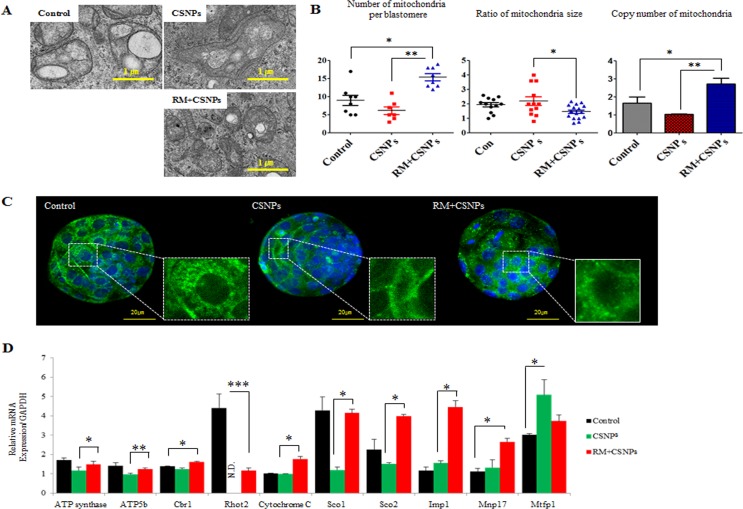
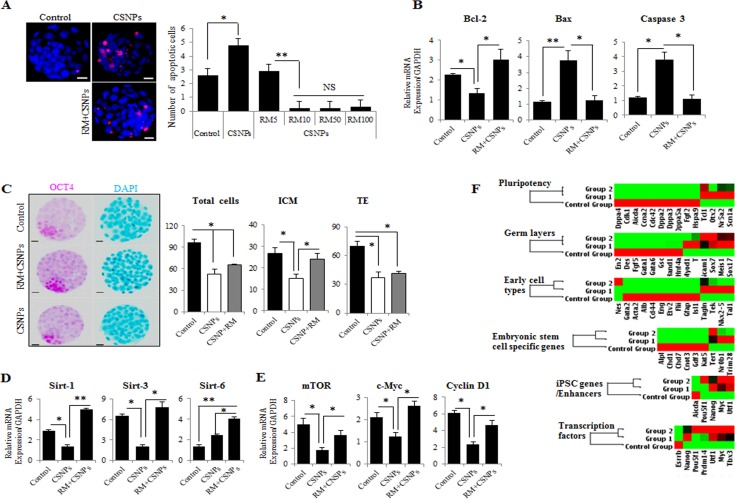
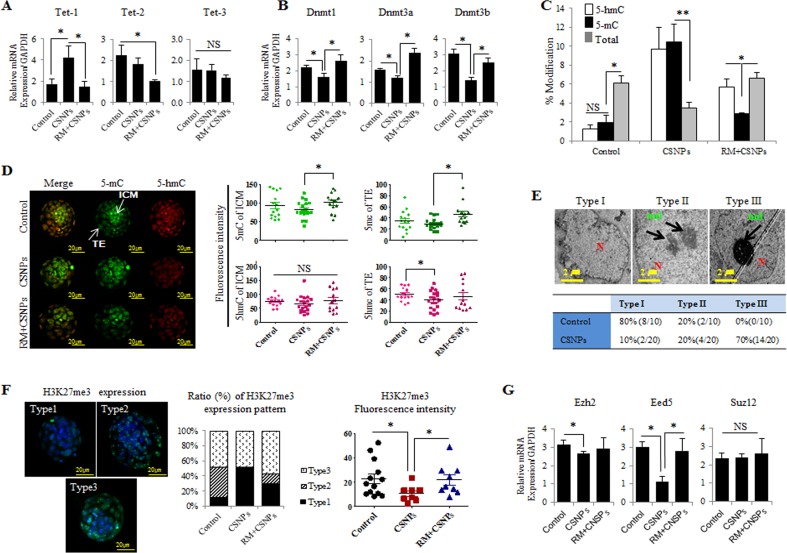
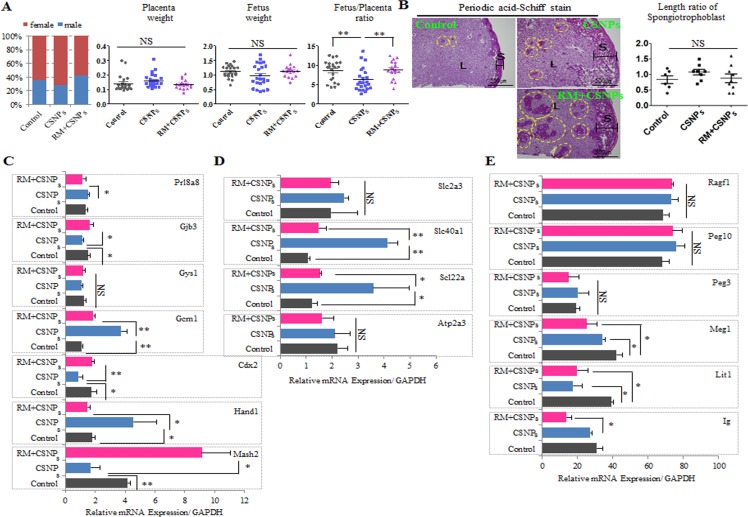
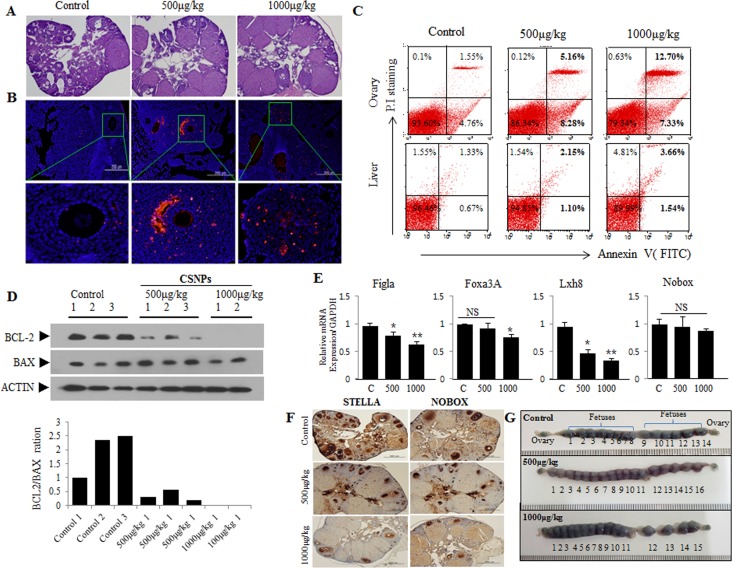
Chitosan nanoparticles (CSNPs) are used as drug or gene delivery vehicles. However, a detailed understanding of the effects of CSNPs on embryonic development remains obscure. Here, we show that CSNPs can be internalized into mouse blastocysts, such as the zona pellucida, the perivitelline space, and the cytoplasm. Consequently, CSNPs-induced endoplasmic reticulum (ER) stress increases both of Bip/Grp78, Chop, Atf4, Perk, and Ire1a mRNAs expression levels, and reactive oxygen species. Moreover, CSNPs show double- and multi-membraned autophagic vesicles, and lead to cell death of blastocoels. Conversely, treatment with rapamycin, which plays an important role as a central regulator of cellular proliferation and stress responses, decreased CSNPs-induced mitochondrial Ca+2 overloading, apoptosis, oxidative stress, ER stress, and autophagy. In vivo studies demonstrated that CSNPs injection has significant toxic effect on primordial and developing follicles. Notably, rapamycin rescued oxidative stress-induced embryonic defects via modulating gene expression of sirtuin and mammalian target of rapamycin. Interestingly, CSNPs treatment alters epigenetic reprogramming in mouse embryos. Overall, these observations suggest that rapamycin treatment could ameliorate CSNPs-induced developmental defects in preimplantation embryos. The data from this study would facilitate to understand the toxicity of these CSNPs, and enable the engineering of safer nanomaterials for therapeutic applications.

Keywords: ER stress; autophagy; chitosan nanoparticles; preimplantation; rapamycin.


Conflict of interest statement

CONFLICTS OF INTEREST

No potential conflicts of interest were disclosed.

Figures

Figure 1
Figure 1. Characterization and localization of CSNPs
A. TEM images of several fields were used to measure the particle sizes of CSNPs. B. Histogram showing the particle size distribution ranging from 80 nm to 160 nm based on TEM images of CSNPs. C. DLS of CSNPs. D. CSNPs penetrated the zona pellucida and exited inside the zona pellucida. The red circle indicates CSNP and shows high magnification. E. CSNPs passed the zona pellucida and are shown in the perivitelline space and cavity. F. Blue and yellow arrows indicate the CSNPs and autophagosomes. G. Green arrow indicates autophagosome (AP). H. Black, green, and yellow arrows indicate mitochondria, autophagosomes, and autophagice vacuoles, respectively. I. Dashed line showed each single cell of CSNPs treated blastocyst. J. The red box shows autophagy and autophagic vesicles. K. High magnification of J, dA and mA indicate double- and multi-membrane vesicles. L. Blue arrows indicate high magnification of autophagosome. M. Orange arrows indicate dilation of the ER lumen.
Figure 2
Figure 2. Effects of rapamycin on CSNPs-induced ER stress and autophagy in preimplantation embryos
A. Morula embryos were cultured with CSNPs with or without rapamycin. Expression levels of genes involved in ER stress, such as Atf4, Ire1a, Chop, Perk, and Grp78, were measured by real time qRT-PCR. Rapamycin-treated groups restored their expression levels. B. Induction of autophagy by CNSPs and the rescue effect of rapamycin. Representative images of cells were taken using a fluorescence microscope. Note the red color showing the localization of punctate LC3. C. Based on immunostaining data, we divided the puncta into two groups (Types I and II). The numbers of LC3 puncta were counted and separated into 2 groups by expression patterns. D. The autophagy-related gene expression analyses were measured by real time qRT-PCR. Atg7, Belcin1, and LC3 mRNA expression levels were significantly induced in the CSNPs-treated group, but were restored by rapamycin treatment. E. Expression analysis of GRP78 and LC3 in CSNPs or rapamycin+CSNPs treated embryos using Western blot. F. CSNPs induced an abnormal developmental rate. Four groups were created based on the developmental rate. Ca2+ and ER stress in cells were analyzed. G. The effects of CSNPs and rapamycin on Rhod-2-AM fluorescence in blastocysts dependent on the developmental rate. H. Blastocysts from each group were labeled with ER tracker to visualize ER localization and expression. ER distribution/expression patterns were evaluated using fluorescence microscopy. I. Expression analysis of calpain2 and type 1 IP3R. * and ** indicate p<0.05,and p<0.01, respectively. RM indicates rapamycin.
Figure 3
Figure 3. The rescue effect of rapamycin on CSNPs-induced ER stress
A. After treatment with CSNPs, morula-stage embryos exhibited developmental delay. Blastocoel size was divided into four groups (0% to 100%) based on the effect caused by CSNPs. B. Immunostaining of OCT3/4 for the ICM marker and CDX2 for the trophoblast cell marker were performed, and then size was measured. The graph shows each cell size. The ICM cell size was larger when the ICM was treated with CSNPs and rapamycin compared to that of the control. In the TE, the cell size was recovered by rapamycin treatment. RP indicates rapamycin. C. The expression levels of various genes involved in ER stress, such as Grp78, Ire1a, Perk, Xbp1, Atf4, Jnk1, and Chop, were determined in each group of blastocysts. *, **, ***, and NS indicate p<0.05, p<0.01, p<0.001, and not significant, respectively..
Figure 4
Figure 4. The rescue effect of rapamycin on CSNPs-induced mitochondrial damage
A. Mitochondrial structural disorganization in blastomeres was determined by TEM. B. The number and size of mitochondria per blastomere were determined by TEN and copy numbers of mitochondria per blastomere were determined by real time qRT-PCR in the control group, the CSNPs-treated group and the group treated with both CSNPs and rapamycin..C. Mitochondrial morphology in the control group, the CSNPs-treated group and the group treated with both rapamycin and CSNPs was visualized via MitoTracker Green FM staining in different groups of blastocysts. D. Mitochondrial activity levels of ATP synthase, ATP5b, Cbr1, Rhot2, Cytochrome C, Sco1, Sco2, Imp1, Mvp17, and Mrfp1 were evaluated using real time qRT-PCR. *, **, ***, NS, and ND indicate p < 0.05, p < 0.01, p < 0.001, not significant, and not determined, respectively. RM indicates rapamycin.
Figure 5
Figure 5. The effects of rapamycin on CSNPs-induced embryonic defects
A. The determination of apoptosis in preimplantation embryos after CSNPs treatment. The numbers of apoptotic cells were measured using TUNEL-positive cells. Apoptotic cells were observed very rarely in the control group. The CSNPs-treated groups showed increased numbers of TUNEL-positive cells. After pre-treatment with rapamycin, apoptosis decreased. Various concentrations of rapamycin (5~100 μg/ml) resulted in the suppression of apoptotic cells. B. Real time qRT-PCR analysis was used to measure Bcl-2, Bax, and Caspase-3 mRNA expression. C. Immunostaining analysis of ICM and TE cells using CDX2 and OCT3/4. The total cell numbers were measured in the ICM and the TE. The CSNPs-treated group showed a lower number of ICM and a lower total cell number. Rapamycin rescued the effect of CSNPs. D. Real time qRT-PCR analysis of the Sirtuin family pathway. E. Real time qRT-PCR analysis of the mTOR pathway. F. The graphs of the validation of self-renewal, ICM, TE, and three germ cell layer markers. The heat map represents the changes in gene expression in the control, CSNPs-treated and rapamycin-pretreated embryos. The 6 groups are clustered around the horizontal axis with gene names on the vertical axis. *, **, and NS indicate p < 0.05, p < 0.01, and not significant, respectively. RM indicates rapamycin.
Figure 6
Figure 6. CSNPs-altered epigenetics in preimplantation embryos
A. Real time qRT-PCR analysis of the Tet family (Tet-1, Tet-2, Tet-3) and B. the Dnmt family (Dnmt1, Dnmt3a, Dnmt3b). C. 5-mC to 5-hmC analysis. D. Immunostaining of 5-mC and 5-hmC. The fluorescence intensities of 5-mC and 5-hmC were measured in both the ICM and the TE. E. Heterochromatin condensation was observed in the control and CNSPs-treated groups using TEM. To calculate each type of heterochromatin and based on the condensation, we divided the embryos into 3 groups: Types I, II and III. Transcriptional silencing is associated with the targeting of genomic sequences to repressive (heterochromatic) nuclear compartments. F. The H3K27me3 expression level was analyzed using immunofluorescence staining. Embryos were divided into Types I, II, and III by their expression patterns. G. The relative expression levels of methylase (Ezh2) and its co-factors (Eed5, Suz12) were measured using real time qRT-PCR analysis. *, **, and NS indicate p<0.05, p<0.01, and not significant, respectively. RM indicates rapamycin.
Figure 7
Figure 7. Comparison of sex ratio, placenta weight, and fetus weight in control and CSNPs or rapamycin+CSNPs treated groups
Mouse blastocysts were treated with or without CSNPs, and with rapamycin+CSNPs, and transferred into uteri of pseudopregnant mice. Pups were recovered by caesarian section at gestational day 20. A. The sex ratio, placenta weight, fetus weight, the fetus and placenta ratio were analyzed. The rapamycin+ CSNPs-treated group showed a fetus/placenta ratio comparable with the control and the CSNPs-treated groups. B. Morphology analysis of placenta by PAS staining from the control, the CSNPs, and CSNPs+rapamycin treated group. PAS positive staining was observed in the decidua and junctional layers. In the spongiotrophoblasts, deep purple color indicates glycogen cells. Of note, CSNPs-treated placenta exhibited a slightly high glycogen cell number/length. CSNPs or CSNPs+rapamycin treated groups showed a lot of mislocation of spongiotrophoblasts. C. The relative expression levels of critical developmental genes, including Mash2, Cdx2, Hand1, Gys1, Gcm1, Prl8a8, and Gjb3, in the E20 placenta. D. Rapamycin rescued abnormal regulation of placental nutrient transporters caused by CSNPs treatment. E. Comparison of Ig, Lit1, Meg1, Peg3, Peg10, and Ragf1 mRNAs expression in full-term derived placentas. *, **, and NS indicate p < 0.05, p < 0.01, and not significant, respectively. RM indicates rapamycin.
Figure 8
Figure 8. Short-term toxic effects on ovary, primodial follicles, and developing fetuses after injection of CSNPs into vein of female mouse
Two different doses (500 or 1000 μg/kg per body weight) of CSNPs were injected into tail vein of female mice. Ten days later, ovaries were recovered from CSNPs-injected female mice. A.-D. shows HE staining, TUNEL assay, Flow cytometry, Western blot analysis, respectively. In CSNPs-injected groups, a lot of apoptosis (red color) was observed. BCL-2 expressions in CSNPs-injected groups are significantly decreased or undetectable. E.-F. Real time qRT-PCR and immunohistochemistry analysis. Expression of Fig 1a, Foxa3A, Lhx8, and Nobox mRNAs, which is a biomaker of primordial follicle, were compared in control and CSNPs-treated groups. G. Comparison of developing fetusus between control and CSNPs treated groups. At 10 day after injection of CSNPs into vein of female mice, female mice were mated with fertile male mice and confirmed varginal plug at next morning (gestational day 0.5). Uteri from each female groups were recovered at gestational day 9.5 (at 19.5 days after CSNPs injection), stained with Chicago blue dye, and counted developing fetuses.

Similar articles

Cited by

References

    1. Donaldson K. Resolving the nanoparticles paradox. Nanomedicine (Lond) 2006;1:229–234. - PubMed
    1. Kagan VE, Bayir H, Shvedova AA. Nanomedicine and nanotoxicology: two sides of the same coin. Nanomedicine. 2005;1:313–316. - PubMed
    1. Linkov I, Satterstrom FK, Corey LM. Nanotoxicology and nanomedicine: making hard decisions. Nanomedicine. 2008;4:167–171. - PubMed
    1. Medina C, Santos-Martinez MJ, Radomski A, Corrigan OI, Radomski MW. Nanoparticles: pharmacological and toxicological significance. Br J Pharmacol. 2007;150:552–558. - PMC - PubMed
    1. Kumar MNVR. A review of chitin and chitosan applications. React Funct Polym. 2000;46:1–27.

MeSH terms