. 2016 Oct 4;7(40):66170-66181.
doi: 10.18632/oncotarget.10818.

Old age at diagnosis increases risk of tumor progression in nasopharyngeal cancer

Affiliations

Old age at diagnosis increases risk of tumor progression in nasopharyngeal cancer

Jing-Dun Xie et al. Oncotarget. .

Abstract

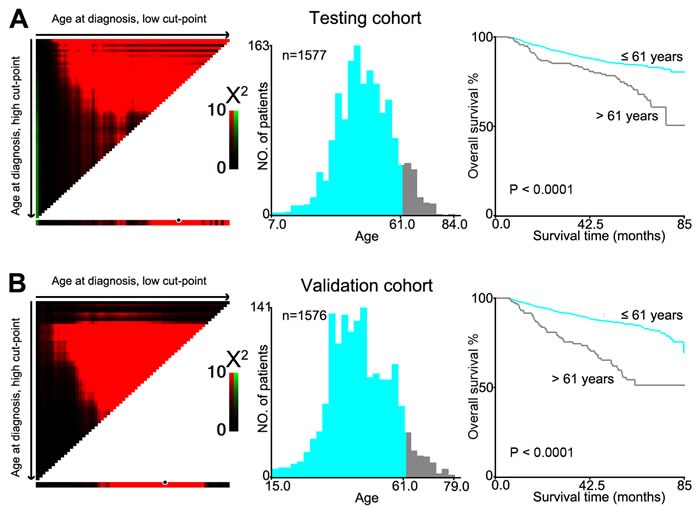
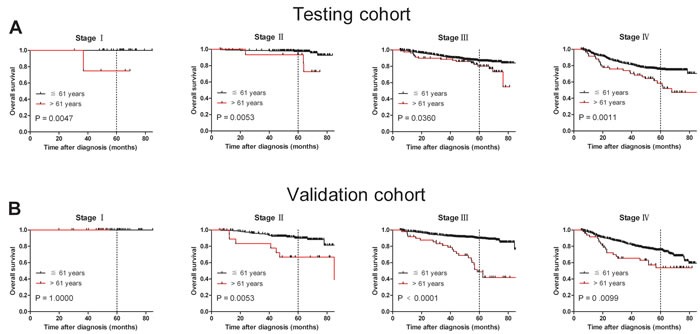
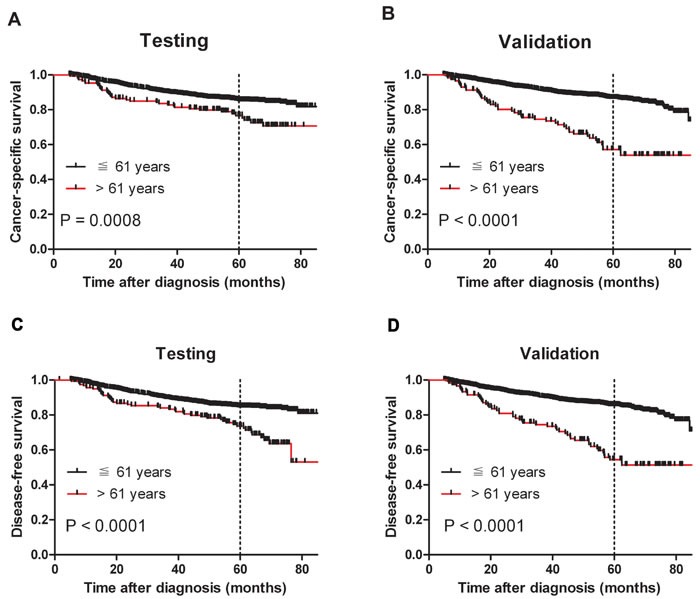
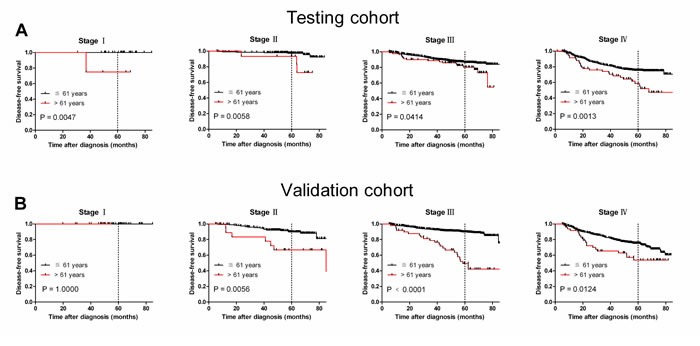
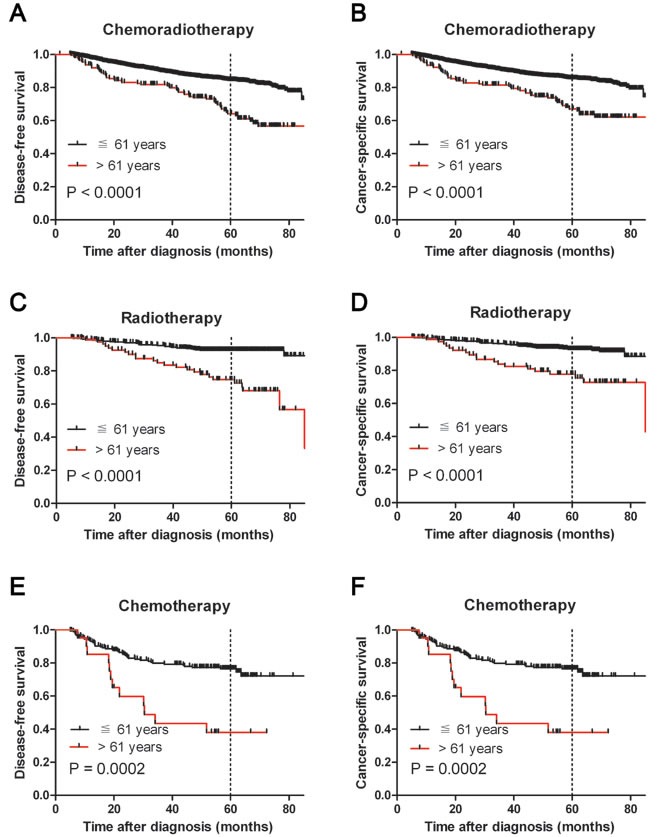
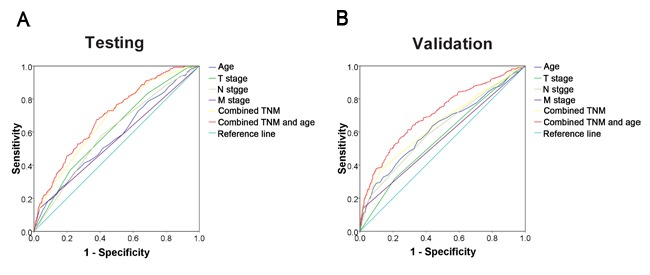
Age at diagnosis has been found to be a prognostic factor of outcomes in various cancers. However, the effect of age at diagnosis on nasopharyngeal cancer (NPC) progression has not been explored. We retrospectively evaluated the relationship between age and disease progression in 3,153 NPC patients who underwent radiotherapy, chemotherapy, or chemoradiotherapy between 2007 and 2009. Patients were randomly assigned to either a testing cohort or a validation cohort by computer-generated random assignment. X-tile plots determined the optimal cut-point of age based on survival status to be ≤61 vs. >61 years. Further correlation analysis showed that age >61 years was significantly correlated with the tumor progression and therapeutic regimen in both testing and validation cohorts (P <0.05). In the present study, we observed that older age (>61 years) was a strong and independent predictor of poor disease-free survival (DFS) and cancer-specific survival (CSS), in both univariate and multivariate analyses. Age was also found to be a significant prognostic predictor as well (P <0.05) when evaluating patients with the same disease stage. ROC analysis confirmed the predictive value of age on NPC-specific survival in both cohorts (P <0.001) and suggested that age may improve the ability to discriminate outcomes in NPCs, especially regarding tumor progression. In conclusion, our study suggests that older age at NPC diagnosis is associated with a higher incidence of tumor progression and cancer-specific mortality. Age is a strong and independent predictor of poor outcomes and may allow for more tailored therapeutic decision-making and individualized patient counseling.

Keywords: age; nasopharyngeal cancer; prognosis; tumor progression.


Conflict of interest statement

CONFLICTS OF INTEREST

The authors have declared that no potential conflict of interest exists.

Figures

Figure 1
Figure 1. X-tile plots were utilized to determine the cutoff value of the age at diagnosis on NPC cohorts
The X-tile program analyzed patient data from the testing cohort. The cutpoint highlighted by the black/white circle in the left panels was demonstrated on a histogram of the entire cohort (middle panels) and a Kaplan-Meier plot (right panels). A. Age at diagnosis was divided at the optional cutpoint, as defined by the most significant on the plot (≦ 61 years vs > 61 years; P < 0.0001). B. The optional cutpoint for age at diagnosis determined by the X-tile plot of the testing cohort was applied to the validation cohort and remained statistically significant (P < 0.0001).
Figure 2
Figure 2. Age at diagnosis was correlated NPC patients' shorter overall survival in subsets of different tumor stages (log-rank test)
A. Stage I, probability of survival of stage I patients with NPC in the testing cohort; ≦ 61 years, n = 33; > 61 years, n = 4. Stage II, probability of survival of stage II patients with NPC in the testing cohort; ≦ 61 years, n = 211; > 61 years, n = 15. Stage III, probability of survival of stage III patients with NPC in the testing cohort; ≦ 61 years, n = 697; > 61 years, n = 82. Stage IV, probability of survival of stage IV patients with NPC in the testing cohort; ≦ 61 years, n = 473; > 61 years, n = 62. B. Stage I, probability of survival of stage I patients with NPC in the validation cohort; ≦ 61 years, n = 42; > 61 years, n = 2. Stage II, probability of survival of stage II patients with NPC in the validation cohort; ≦ 61 years, n = 206; > 61 years, n = 19. Stage III, probability of survival of stage III patients with NPC in the validation cohort; ≦ 61 years, n = 758; > 61 years, n = 49. Stage IV, probability of survival of stage IV patients with NPC in the validation cohort; ≦ 61 years, n = 451; > 61 years, n = 49.
Figure 3
Figure 3. Older age was associated with shorter NPC cancer-specific survival and disease-free survival (log-rank test)
A. Probability of cancer-specific survival of patients with NPC in the testing cohort; ≦ 61 years, n = 1404; > 61 years, n = 153. B. Probability of cancer-specific survival of patients with NPC in the validation cohort; ≦ 61 years, n = 1435; > 61 years, n = 115. C. Probability of disease-free survival of patients with NPC in the testing cohort; ≦ 61 years, n = 1414; > 61 years, n = 163. D. Probability of disease-free survival of patients with NPC in the validation cohort; ≦ 61 years, n = 1457; > 61 years, n = 119.
Figure 4
Figure 4. Older age was associated with shorter NPC disease-free survival in subsets of different cancer stages (log-rank test)
A. Stage I, probability of survival of stage I patients with NPC in the testing cohort; ≦ 61 years, n = 33; > 61 years, n = 4. Stage II, probability of survival of stage II patients with NPC in the testing cohort; ≦ 61 years, n = 211; > 61 years, n = 15. Stage III, probability of survival of stage III patients with NPC in the testing cohort; ≦ 61 years, n = 697; > 61 years, n = 82. Stage IV, probability of survival of stage IV patients with NPC in the testing cohort; ≦ 61 years, n = 473; > 61 years, n = 62. B. Stage I, probability of survival of stage I patients with NPC in the validation cohort; ≦ 61 years, n = 42; > 61 years, n = 2. Stage II, probability of survival of stage II patients with NPC in the validation cohort; ≦ 61 years, n = 206; > 61 years, n = 19. Stage III, probability of survival of stage III patients with NPC in the validation cohort; ≦ 61 years, n = 758; > 61 years, n = 49. Stage IV, probability of survival of stage IV patients with NPC in the validation cohort; ≦ 61 years, n = 451; > 61 years, n = 49.
Figure 5
Figure 5. Kaplan-Meier survival analysis of age at diagnosis in subsets of total NPC patients in different therapeutic regimen groups (log-rank test)
Probability of survival of NPC patients with chemoradiotherapy in disease-free survival A. and cancer-specific survival B. Probability of survival of NPC patients with radiotherapy in disease-free survival C. and cancer-specific survival D. Probability of survival of NPC patients with chemotherapy in disease-free survival E. and cancer-specific survival F.
Figure 6
Figure 6. ROC curve analysis for different clinicopathological features was performed to evaluate the survival status
A. Age (AUC = 0.573; P < 0.001), T stage (AUC = 0.613; P < 0.001), N stage (AUC = 0.595; P < 0.001), M stage (AUC = 0.552; P = 0.008), combined TNM (AUC = 0.678; P < 0.001), and combined TNM and age (AUC = 0.696; P < 0.001) indicated significant associations with survival status in the testing cohort. B. Age (AUC = 0.623; P < 0.001), T stage (AUC = 0.564; P = 0.001), N stage (AUC = 0.616; P < 0.001), M stage (AUC = 0.560; P = 0.002), combined TNM (AUC = 0.650; P < 0.001), and combined TNM and age (AUC = 0.709; P < 0.001) were used to test the survival status in the validation cohort.

Similar articles

Cited by

References

    1. Huang TR, Zhang SW, Chen WQ, Deng W, Zhang CY, Zhou XJ, Zhai RH. Trends in nasopharyngeal carcinoma mortality in China, 1973-2005. Asian Pacific journal of cancer prevention. 2012;13:2495–2502. - PubMed
    1. Black RJ, Bray F, Ferlay J, Parkin DM. Cancer incidence and mortality in the European Union: cancer registry data and estimates of national incidence for 1990. European journal of cancer. 1997;33:1075–1107. - PubMed
    1. Yu MC, Yuan JM. Epidemiology of nasopharyngeal carcinoma. Seminars in cancer biology. 2002;12:421–429. - PubMed
    1. Ren JS, Chen WQ, Shin HR, Ferlay J, Saika K, Zhang SW, Bray F. A comparison of two methods to estimate the cancer incidence and mortality burden in China in 2005. Asian Pacific journal of cancer prevention. 2010;11:1587–1594. - PubMed
    1. Chang ET, Adami HO. The enigmatic epidemiology of nasopharyngeal carcinoma. Cancer epidemiology, biomarkers & prevention. 2006;15:1765–1777. - PubMed

LinkOut - more resources