. 2016 Sep 13;7(37):59144-59157.
doi: 10.18632/oncotarget.10828.

Loss of ZFP36 expression in colorectal cancer correlates to wnt/ ß-catenin activity and enhances epithelial-to-mesenchymal transition through upregulation of ZEB1, SOX9 and MACC1

Affiliations

Loss of ZFP36 expression in colorectal cancer correlates to wnt/ ß-catenin activity and enhances epithelial-to-mesenchymal transition through upregulation of ZEB1, SOX9 and MACC1

Lucia Montorsi et al. Oncotarget. .

Abstract

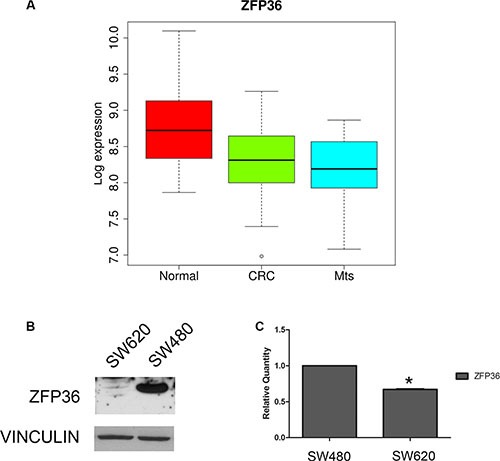
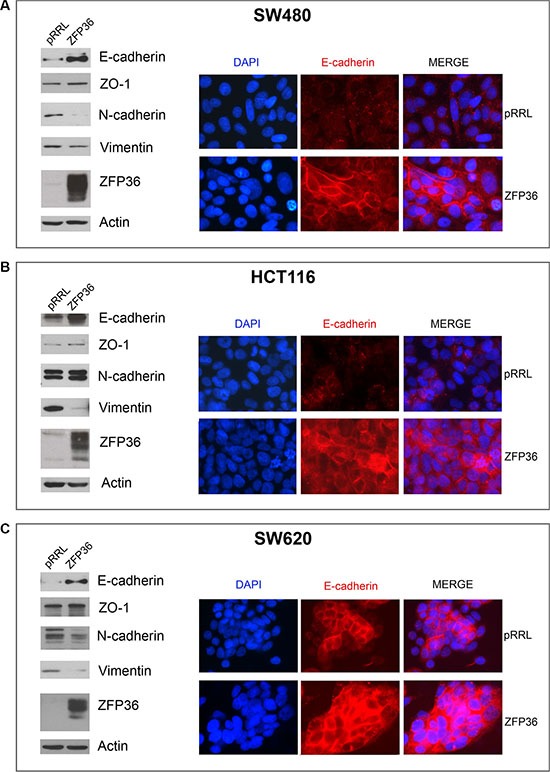
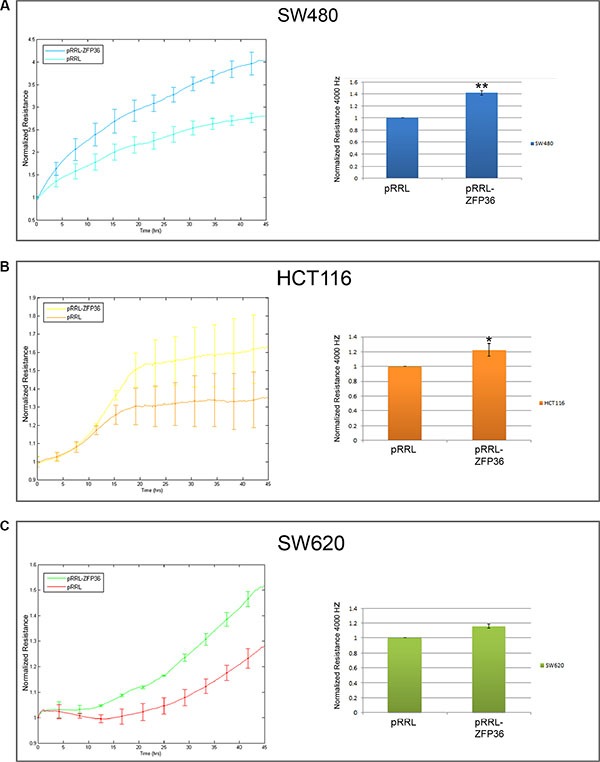
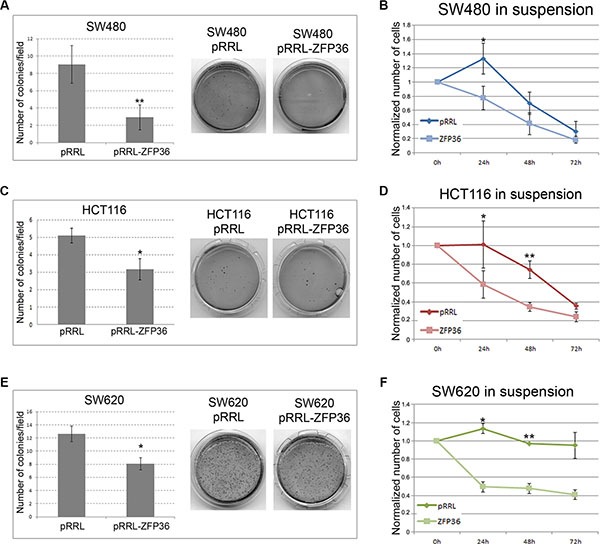
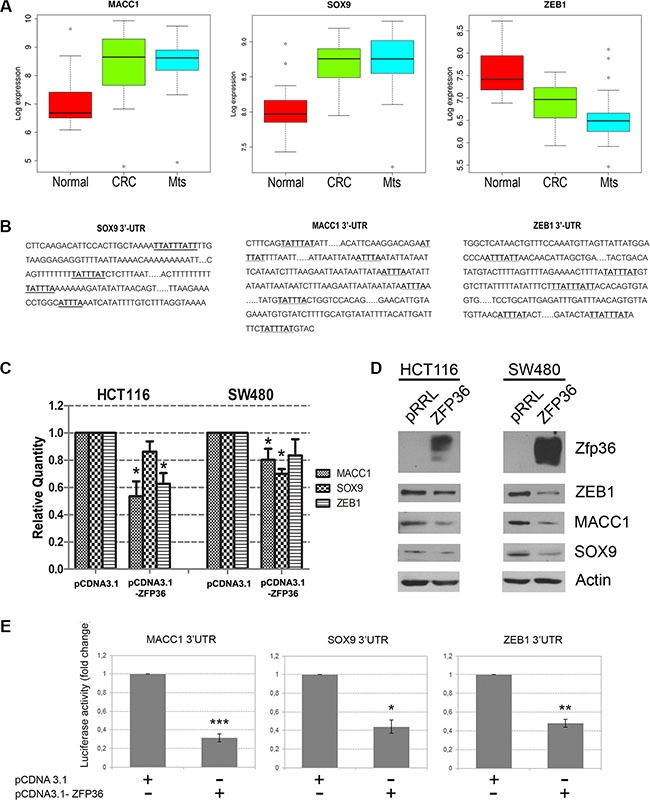
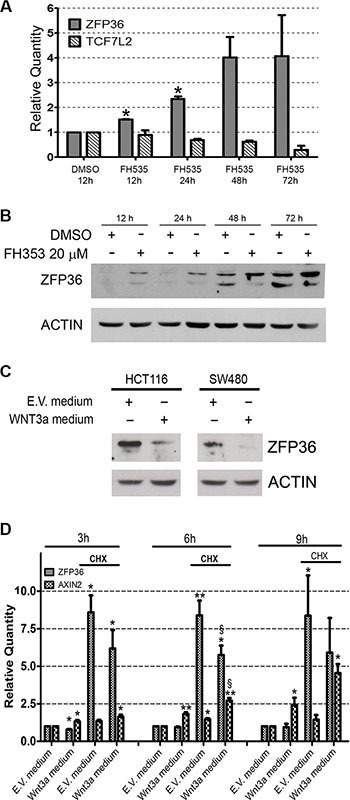
The mRNA-destabilizing protein ZFP36 has been previously described as a tumor suppressor whose expression is lost during colorectal cancer development. In order to evaluate its role in this disease, we restored ZFP36 expression in different cell contexts, showing that the presence of this protein impairs the epithelial-to-mesenchymal transition (EMT) and induces a higher susceptibility to anoikis. Consistently, we found that ZFP36 inhibits the expression of three key transcription factors involved in EMT: ZEB1, MACC1 and SOX9. Finally, we observed for the first time that its expression negatively correlates with the activity of Wnt/β-catenin pathway, which is constitutively activated in colorectal cancer. This evidence provides a clue on the mechanism leading to the loss of ZFP36 in CRC.

Keywords: ZFP36; colon cancer; epithelial mesenchymal transition; tristetraprolin; β-catenin.


Conflict of interest statement

CONFLICTS OF INTEREST

None.

Figures

Figure 1
Figure 1. Analysis of ZFP36 expression in CRC-related samples
(Panel A) Boxplot of ZFP36 mRNA Log2 expression levels evaluated in a GEO database of gene expression profiles derived from 23 normal colon mucosa (Normal), 30 primary colon carcinoma (CRC) and 27 liver metastases (Mts) samples. The thick line indicates the median value, the coloured box indicates the interquartile range and the whiskers the minimum and maximum values excluded outliers. Open circles represent data points outside the whiskers. (Panel B) ZFP36 protein expression in CRC cell lines derived from primary tumour (SW480) and matched metastatic lesion (SW620). Vinculin was used as loading control. (Panel C) ZFP36 mRNA levels detected in SW480 and SW620 cell lines through qRT-PCR. Results are represented as means of two experiments (+/− SEM) and GAPDH was used as endogenous control. *p < 0.05.
Figure 2
Figure 2. Analysis of epithelial markers in ZFP36 overexpressing cells
SW480 (Panel A), HCT116 (Panel B) and SW620 (Panel C) were infected with empty vector (pRRL) or ZFP36-overexpressing vector (ZFP36) and the corresponding total protein lysates were analysed through Western blot using antibodies against E-cadherin, ZO-1, N-cadherin, Vimentin and ZFP36. Actin was used as a loading control. The same cells were seeded on glass dishes and subsequently subjected to immunofluorescence analysis with antibody against E-cadherin (red) to assess its sub-cellular localization. Nuclei were counterstained with DAPI (blue).
Figure 3
Figure 3. ZFP36 overexpression increases epithelial barrier function
SW480 (Panel A), HCT116 (Panel B) and SW620 (Panel C) infected with empty vector (pRRL) or ZFP36-overexpressing vector (pRRL-ZFP36) were seeded on uncoated gold microelectrodes and subjected to a small alternating current. Immediately after seeding, resistance at 4000 Hz was recorded every 5 minutes for at least 45 hours. Graphs on the left-hand side of the panel show the mean of the normalized resistance for three different experiments plotted in function of time (+/−SEM). The histograms on the right-hand side of each panel summarize the results described in the graphs: approximately 48 hours after seeding, resistance at 4000 z became stable and was recorded for further 5 hours. Values obtained during the last 5 hours were averaged and normalized on pRRL values. *p < 0.05, **p < 0.001.
Figure 4
Figure 4. ZFP36 overexpression impairs anchorage-independent-growth and sensitizes to anoikis
SW480 (Panel A), HCT116 (Panel C) and SW620 (Panel E) infected with empty vector (pRRL) or ZFP36-overexpressing vector (pRRL-ZFP36) were seeded in soft-agar medium (DMEM + 0.3% Agar) and allowed to form colonies. The efficiency in colonies formation was then evaluated by randomly selecting 10 optical fields for each plate and calculating the average number of colonies. The histograms represent these figures as the mean of three independent experiments +/−SEM. Photographs show the crystal-violet staining of one representative experiment. In (panels B, D and F) equal amounts of respectively SW480, HCT116 and SW620 infected with pRRL or ZFP36 vectors were seeded in presence of Dispase to prevent cell adhesion (in suspension). Vital cells were then counted through Trypan blue exclusion assay. Results were normalized on the number of seeded cells and reported as the mean of three independent experiments (+/− SEM). *p < 0.05, **p < 0.001.
Figure 5
Figure 5. ZFP36 restoration in CRC cell lines exerts minor effects on cellular migration
(Panel A) SW480, HCT116 and SW620 infected with empty vector (pRRL) or ZFP36-overexpressing vector (pRRL-ZFP36) were seeded on uncoated gold microelectrodes and subjected to a small alternating current. After reaching complete confluence, a wound in the cellular layer was produced by applying a high voltage pulse and the recovery of the cellular monolayer was monitored by measuring Resistance at 4000 Hz. The graphs shown represent a single experiment. (Panel B) SW480, HCT116 and SW620 infected with empty vector (pRRL) or ZFP36-overexpressing vector (pRRL-ZFP36) were grown until complete confluence, and a scratch on cellular monolayer was performed with a pipette tip. The results of one representative experiment are shown in the photographs. (Panel C) SW480 and HCT116 infected with empty vector (pRRL) or ZFP36 overexpressing vector (pRRL-ZFP36) were serum-starved and seeded inside the upper chamber of 8 μm-pore transwell insert. Cells were then allowed to migrate towards a chemo-attractant stimulus (FBS) for 16 hours. Migrated nuclei were stained with DAPI and quantified by taking random pictures. Results obtained were normalized on the pRRL values and represented as the mean of three independent experiments.
Figure 6
Figure 6. Validation of three novel ZFP36 target genes involved in EMT
(Panel A) Boxplot of Log 2 expression values of MACC1, SOX9 and ZEB1 in 23 normal colon mucosa (Normal), 30 primary colon carcinoma (CRC) and 27 liver metastases (Mts) samples. The thick line indicates the median value, the coloured box indicates the interquartile range and the whiskers the minimum and maximum values excluded outliers. Open circles represent data points outside the whiskers. (Panel B) Schematic representation of the 3′UTRs sequences of MACC1, SOX9 and ZEB1. A-U rich sequences (ARE) are highlighted in bold. (Panel C) HCT116 and SW480 cells were transfected with an empty vector (pCDNA3.1) or a ZFP36-overexpressing vector (pCDNA3.1-ZFP36). RNA was extracted after 48 hours and MACC1, SOX9, ZEB1 mRNA levels were analysed through qRT-PCR analysis. Results are represented as means of three experiments (+/−SEM) and GAPDH was used as endogenous control. *p < 0.05. (Panel D) HCT116 and SW480 were infected with an empty vector (pRRL) or a ZFP36-overexpressing vector (ZFP36) and corresponding total protein lysates were analysed through Western blotting techniques with antibodies against ZEB1, MACC1, SOX9 and ZFP36. Actin was used as loading control. (Panel E) A fragment of the 3′UTRs of MACC1, SOX9 and ZEB1 was cloned in a pGL3 vector, downstream of the Luciferase gene. These constructs where co-transfected with a Δ-gal reporter plasmid and with an empty vector (pCDNA3.1) or ZFP36 overexpressing vector (pCDNA3.1-ZFP36) in HEK293T cells. Cells were harvested after 48 hours, luciferase activity was measured and normalized over Δ-gal signals. Results are represented as means of three independent experiments +/−SEM. *p < 0.05, **p < 0.001, ***p < 0.0001.
Figure 7
Figure 7. Wnt/β-catenin pathway inversely regulates ZFP36 expression
(Panel A) HCT116 were treated with FH353 20 μM or vehicle (DMSO) for the indicated time. RNA was extracted, retro-transcribed and used for real-time qRT-PCR analysis of ZFP36 and TCF7L2 transcripts. Results were normalized on DMSO values at each time point. Histograms represent the mean of two independent experiments (+/−SEM), GAPDH was used as endogenous control. *p < 0.05. (Panel B) HCT116 treated as in panel A were lysed and equal amounts of total protein extracts were loaded on a SDS-PAGE and subsequently analysed through Western blot techniques with an antibody against ZFP36. Actin was used as loading control. (Panel C) HCT116 and SW480 were treated with conditioned medium obtained from empty vector cells (E.V medium) or Wnt3a overexpressing cells (Wnt3a medium). After 24 hours, cells were collected, lysed and equal amounts of protein were loaded on SDS-PAGE and subsequently analysed through Western blot technique with an antibody against ZFP36. Actin was used as loading control. (Panel D) HCT116 were treated with E.V. medium and Wnt3a medium supplemented with Cyclohexymide (CHX) or DMSO (not indicated). After the indicated amount of time, RNA was extracted, retro-transcribed and used for real-time PCR analysis of ZFP36 and Axin2 transcripts. Results were normalized on E.V. medium values at each time point. Histograms represent the mean of four independent experiments (+/−SEM), GAPDH was used as endogenous control. *= p < 0.05, **= p < 0.001. §= p < 0.05 if t-test was performed on the values obtained from Wnt3a-CHX treated cells in comparison to E.V medium-CHX treated cells.

References

    1. Bardhan K, Liu K. Epigenetics and colorectal cancer pathogenesis. Cancers. 2013;5:676–713. - PMC - PubMed
    1. Clevers H, Nusse R. Wnt/beta-Catenin Signaling and Disease. Cell. 2012;149:1192–1205. - PubMed
    1. Kalluri R, Weinberg RA. The basics of epithelial-mesenchymal transition. J Clin Invest. 2009;119:1420–1428. - PMC - PubMed
    1. Lamouille S, Xu J, Derynck R. Molecular mechanisms of epithelial-mesenchymal transition. Nat Rev Mol Cell Bio. 2014;15:178–196. - PMC - PubMed
    1. Peinado H, Olmeda D, Cano A. Snail, ZEB and bHLH factors in tumour progression: an alliance against the epithelial phenotype? Nat Rev Cancer. 2007;7:415–428. - PubMed

MeSH terms