. 2016 Jul 26;111(2):373-385.
doi: 10.1016/j.bpj.2016.06.010.

Spontaneous Formation of a Globally Connected Contractile Network in a Microtubule-Motor System

Affiliations

Spontaneous Formation of a Globally Connected Contractile Network in a Microtubule-Motor System

Takayuki Torisawa et al. Biophys J. .

Abstract

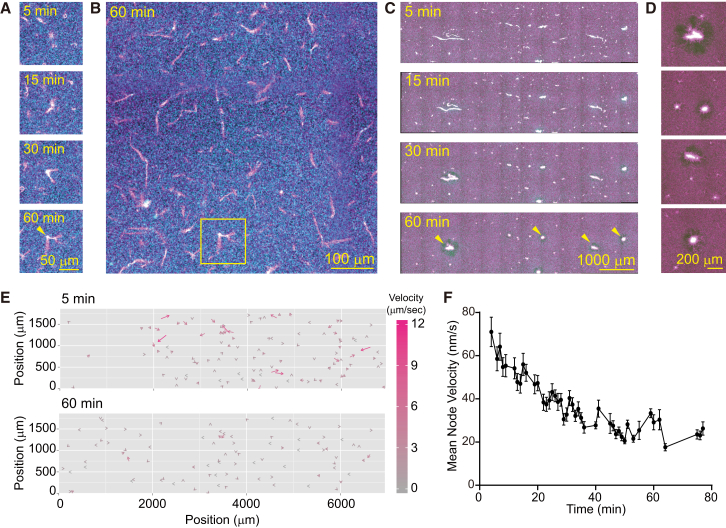
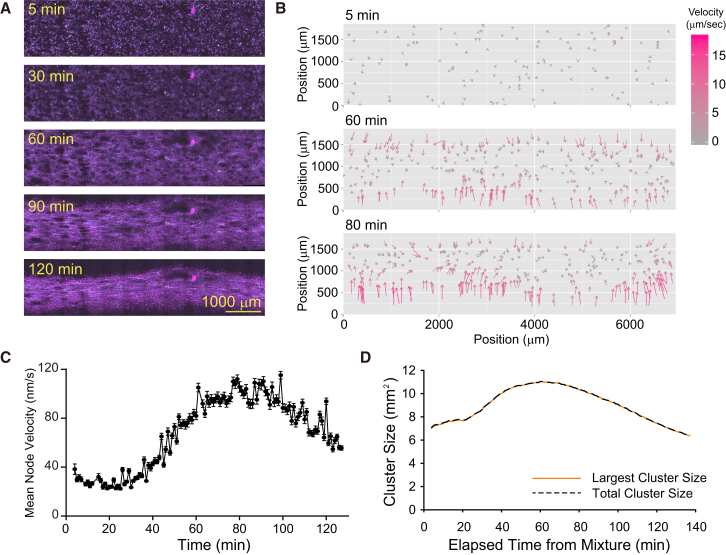
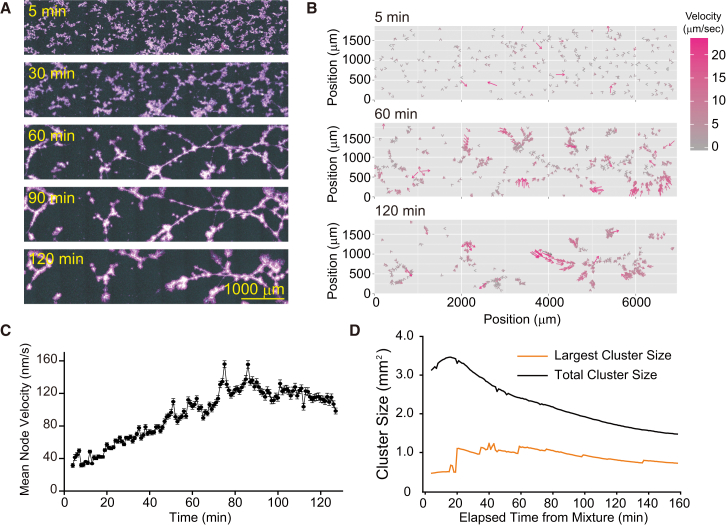
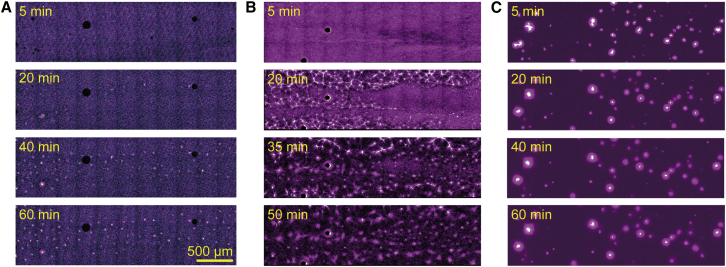
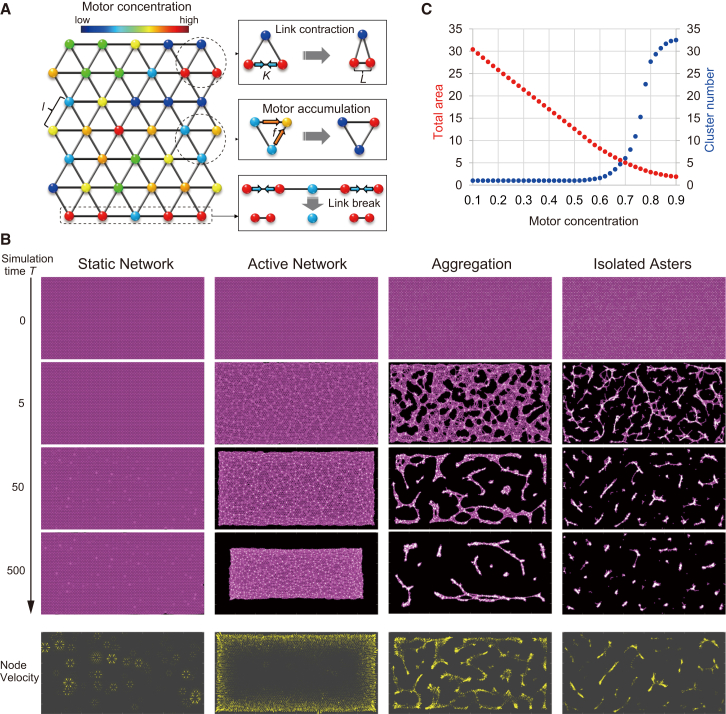
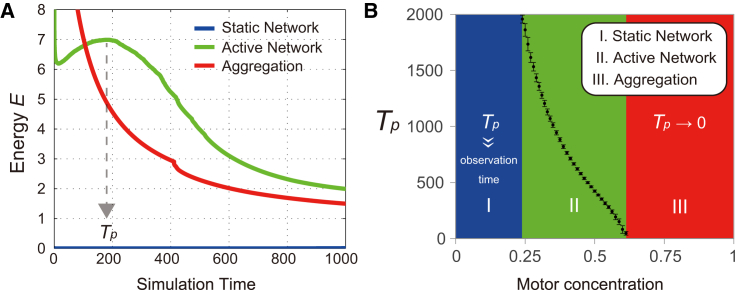
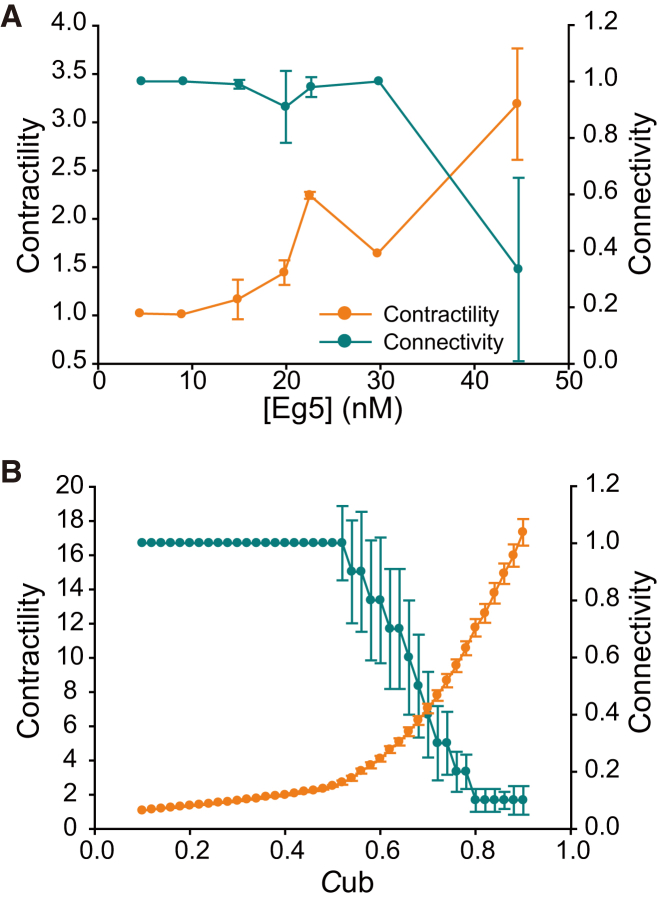
Microtubule (MT) networks play key roles in cell division, intracellular transport, and cell motility. These functions of MT networks occur through interactions between MTs and various associated proteins, notably motor proteins that bundle and slide MTs. Our objective in this study was to address the question of how motors determine the nature of MT networks. We conducted in vitro assays using homotetrameric kinesin Eg5, a motor protein involved in the formation and maintenance of the mitotic spindle. The mixing of Eg5 and MTs produced a range of spatiotemporal dynamics depending on the motor/filament ratio. Low motor/filament ratios produced globally connected static MT networks with sparsely distributed contractile active nodes (motor-accumulating points with radially extending MTs). Increasing the motor/filament ratio facilitated the linking of contractile active nodes and led to a global contraction of the network. When the motor/filament ratio was further increased, densely distributed active nodes formed local clusters and segmented the network into pieces with their strong contractile forces. Altering the properties of the motor through the use of chimeric Eg5, which has kinesin-1 heads, resulted in the generation of many isolated asters. These results suggest that the spatial distribution of contractile active nodes determines the dynamics of MT-motor networks. We then developed a coarse-grained model of MT-motor networks and identified two essential features for reproducing the experimentally observed patterns: an accumulation of motors that form the active nodes necessary to generate contractile forces, and a nonlinear dependency of contractile force on motor densities. Our model also enabled us to characterize the mechanical properties of the contractile network. Our study provides insight into how local motor-MT interactions generate the spatiotemporal dynamics of macroscopic network structures.


Figures

Figure 1
Figure 1
Self-organized structures emerged from the mixture of MTs and Eg5. (A) Time-series images showing the formation of bundled MT structures under low MT and Eg5 concentrations ([tubulin] = 10 nM, [Eg5] = 2.97 nM). The images for ATTO647N-labeled MT (magenta) and GFP-fused Eg5 (cyan) are merged. The times displayed in the images represent the time that elapsed after initial mixing. The arrowhead in the bottom image (60 min) indicates a jointed point of bundled MTs. (B) General image of bundled MT structures. The yellow box denotes the MT structure shown in (A). (C) Time-series images show the time-dependent evolutionary dynamics of astral structures in the crowded MTs ([tubulin] = 1 μM, [Eg5] = 8.91 nM). The times displayed in the images represent the time that elapsed after mixing. The arrowheads in the bottom image (60 min) indicate the formation of astral MT structures, with Eg5 accumulated at their centers. (D) Enlarged images of astral MT structures shown by the arrowheads in (C). (E) Vector field representation of node velocities in the static network shown in (C). The velocity of each node is shown by the length of the arrows and the color scale. (F) Temporal evolution pattern of the mean node velocity in the static network shown in (C). The mean value and standard deviation (SD) are shown. The total trace number of nodes is 216.
Figure 2
Figure 2
Formation and contraction of MT networks by a motile cross-linker. (A) Time-series images showing the formation of a globally connected contractile MT network ([tubulin] = 1 μM, [Eg5] = 22.5 nM). The images of ATTO647N-labeled MTs (magenta), ATTO565-labeled MTs (yellow), and GFP-fused Eg5 (cyan) are merged. The times displayed in the images represent the times that elapsed after mixing. (B) Time-dependent evolutionary pattern of the vector field representation of node velocities in the active network shown in (A). The velocity of each node is indicated by the length of arrows and the color scale. (C) Temporal evolution pattern of the mean node velocity in the active network shown in (A). The mean value and SD are shown. The total trace number of nodes is 1572. (D) Temporal evolution pattern of the size of total cluster and the largest cluster.
Figure 3
Figure 3
The strong contraction force caused by a motile cross-linker results in MT network fragmentation. (A) Time-series images showing the formation of a globally connected contractile MT network ([tubulin] = 1 μM, [Eg5] = 45 nM). Images of ATTO647N-labeled MTs (magenta), ATTO565-labeled MTs (yellow), and GFP-fused Eg5 (cyan) are merged. The times displayed in the images represent the time that elapsed after mixing. (B) Vector field representation of node velocities in the aggregation shown in (A). The velocity of each node is indicated by the length of the arrows and the color scale. (C) Temporal evolution pattern of the mean node velocities in the aggregation shown in (A). (D) Temporal evolution pattern of the size of the total cluster and the largest cluster.
Figure 4
Figure 4
Spatiotemporal dynamics of the MT network driven by KIF5Bhead-Eg5tail. Time-lapse images show the temporal evolution of isolated asters. Images of taxol-stabilized ATTO647N-labeled MTs (magenta), ATTO565-labeled MTs (yellow), and KIF5Bhead-Eg5tail (cyan) are merged. (A–C) The KIF5Bhead-Eg5tail concentration was 6.25 nM (A), 12.5 nM (B), or 37.5 nM (C).
Figure 5
Figure 5
Coarse-grained model of the filament motor system. (A) Schematic representations of the model and its dynamic rules. Two adjacent active nodes contract with each other with strength K. Motors accumulate against the concentration gradient with flux f. A link is severed when it is elongated above a threshold length Lc. The motor concentration at each node is represented by the color spectrum. (B) Spatiotemporal dynamics of the model for different motor concentrations (Cub) and the parameters K and f. (Cub, K, f) = (0.1, 15, 0.01), (0.4, 15, 0.01), (0.7, 15, 0.01), and (0.9, 30, 0.02) for the static network, active network, aggregation, and isolated cluster, respectively. Links are depicted by magenta lines and motors are depicted by white circles. Node velocities at T = 50 are shown by yellow arrowheads, sized in proportion to the velocity magnitude. (C) Total areas (red) and cluster numbers (blue) measured at T = 500 are displayed as a function of the motor concentration. (K, f) = (15, 0.01). Circles denote the mean value for 100 repeated simulations, starting with randomized initial distributions of the motor concentration.
Figure 6
Figure 6
Mechanical properties of the model MT networks. (A) Temporal changes in the total elastic energy (E) stored in the system for the static network (Cub = 0.1), active network (Cub = 0.59), and aggregation (Cub = 1.0) patterns. (B) Relationship between the time at which E reaches a local maximum, Tp, and the motor concentration, Cub. Bars reflect the standard deviation of the mean value for 100 repeated simulations, starting with randomized initial distributions of the motor concentration. The model parameters are the same as those in Fig. 5B.
Figure 7
Figure 7
Contractility and connectivity of MT networks. (A) Dependence of contractility and connectivity on the Eg5 concentration in the experiments. The mean and standard deviation are shown. Number of observed chambers: one (4.5 nM), one (8.9 nM), five (14.9 nM), three (19.8 nM), five (22.5 nM), one (29.7 nM), and five (45 nM), respectively. (B) Dependence of contractility and connectivity on the motor concentration, Cub, in the simulations. Average values are shown, with bars reflecting the SD of the mean value for 100 repeated simulations, starting with randomized initial distributions of the motor concentration.

References

    1. Alberts B., Johnson A., Walter P. 4th ed. Garland Science; New York: 2002. Molecular Biology of the Cell.
    1. Karsenti E. Self-organization in cell biology: a brief history. Nat. Rev. Mol. Cell Biol. 2008;9:255–262. - PubMed
    1. Huber F., Schnauß J., Käs J. Emergent complexity of the cytoskeleton: from single filaments to tissue. Adv. Phys. 2013;62:1–112. - PMC - PubMed
    1. Mimori-Kiyosue Y. Shaping microtubules into diverse patterns: molecular connections for setting up both ends. Cytoskeleton (Hoboken) 2011;68:603–618. - PubMed
    1. de Forges H., Bouissou A., Perez F. Interplay between microtubule dynamics and intracellular organization. Int. J. Biochem. Cell Biol. 2012;44:266–274. - PubMed

LinkOut - more resources