

Optical Mapping of Membrane Potential and Epicardial Deformation in Beating Hearts
- PMID: 27463145
- PMCID: PMC4968426
- DOI: 10.1016/j.bpj.2016.03.043
Optical Mapping of Membrane Potential and Epicardial Deformation in Beating Hearts
Abstract
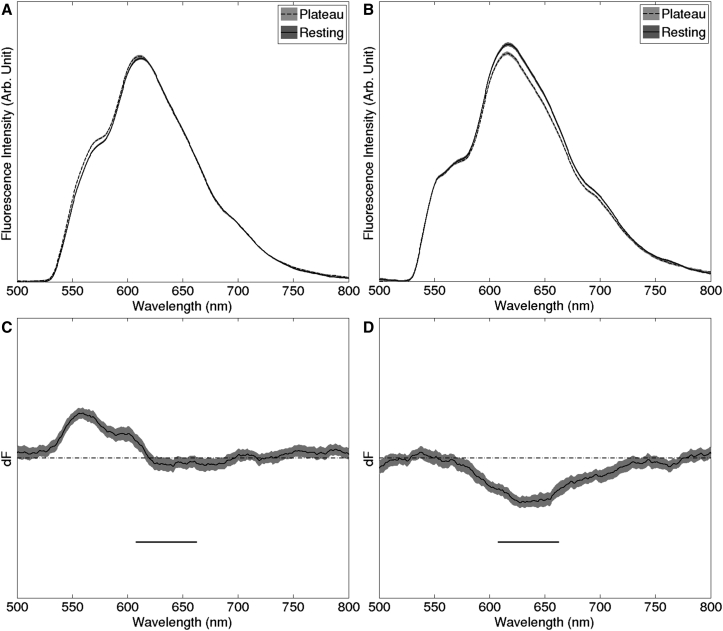
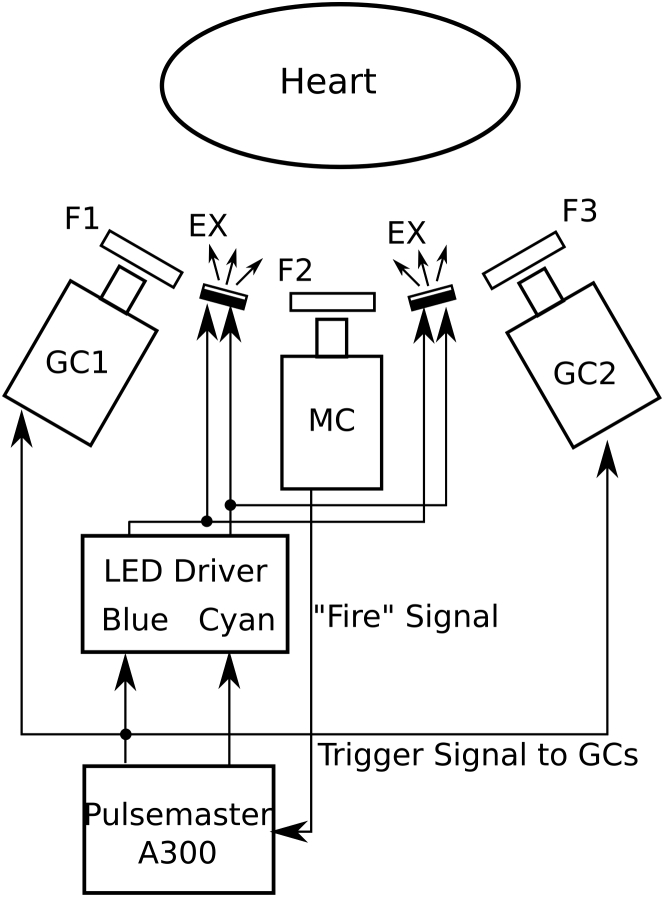
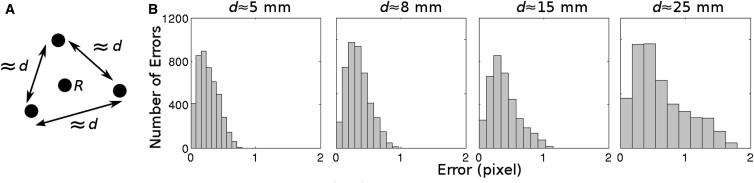
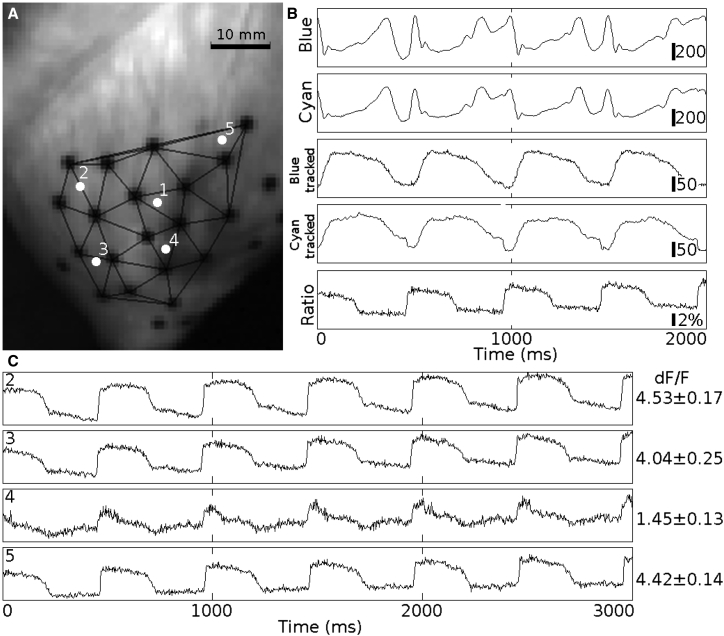
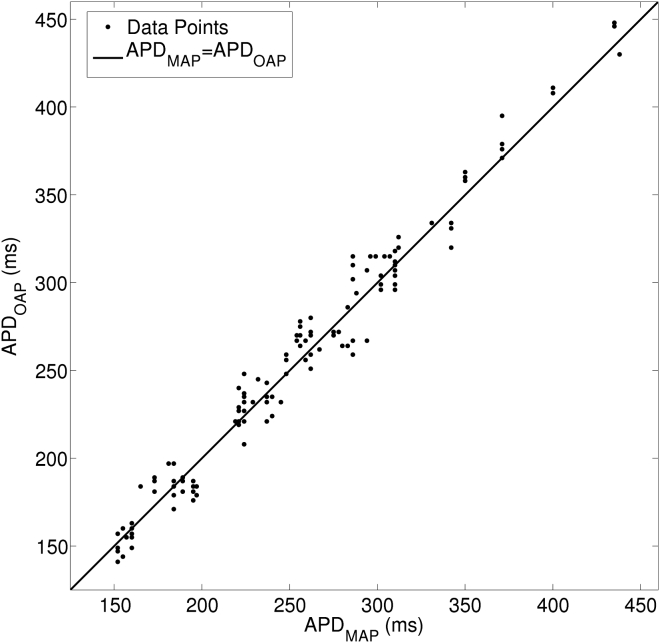
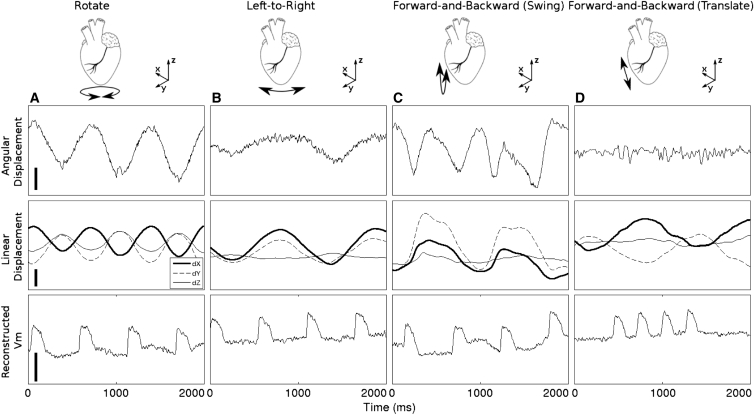
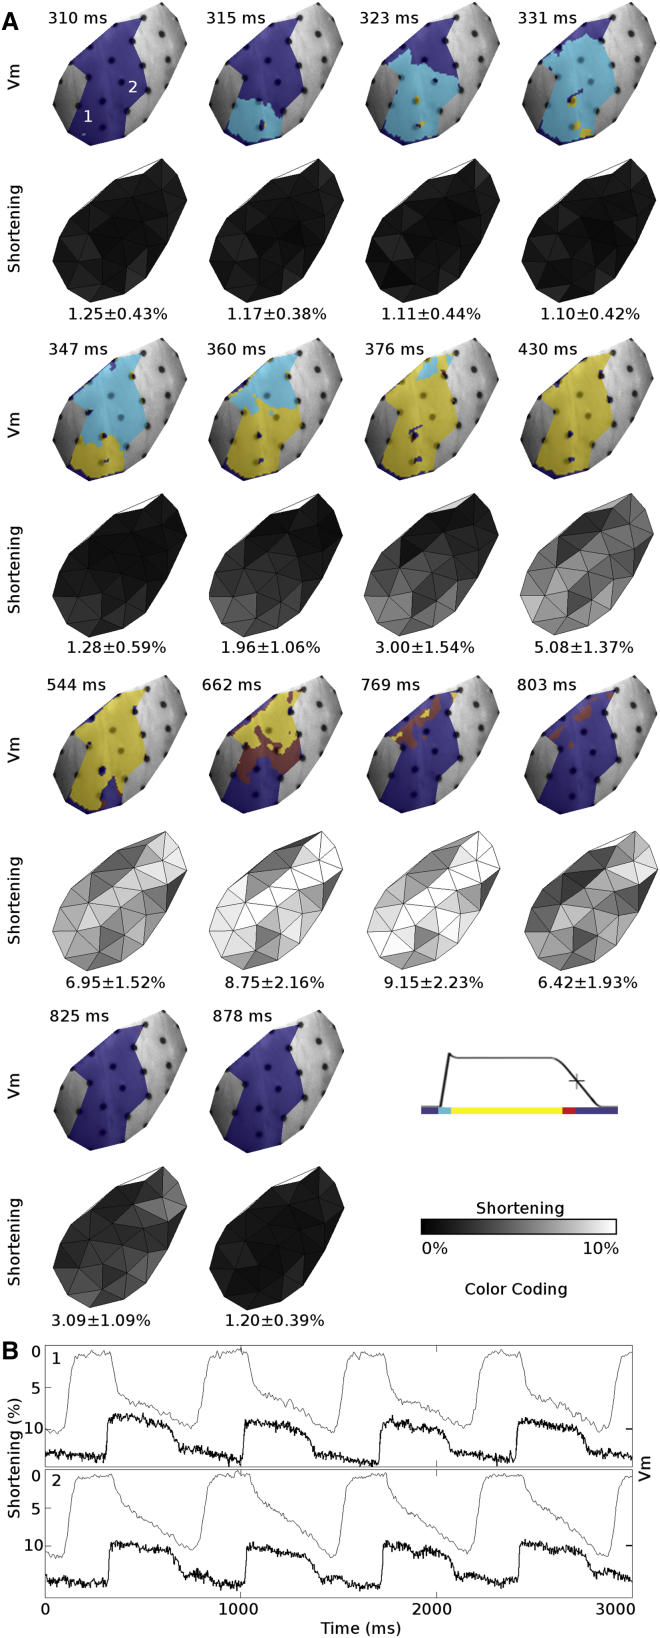
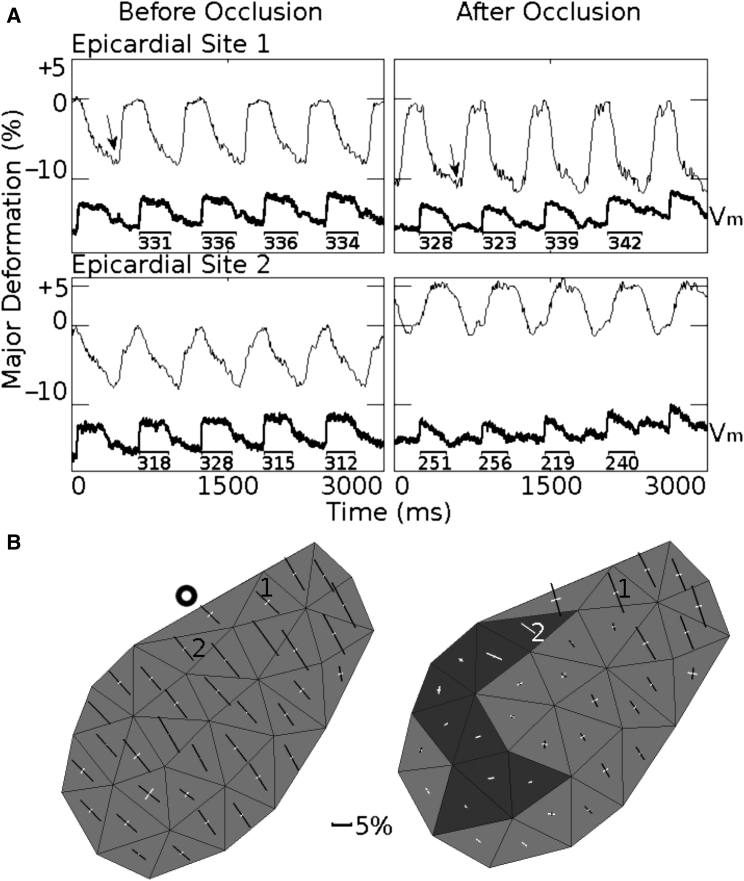
Cardiac optical mapping uses potentiometric fluorescent dyes to image membrane potential (Vm). An important limitation of conventional optical mapping is that contraction is usually arrested pharmacologically to prevent motion artifacts from obscuring Vm signals. However, these agents may alter electrophysiology, and by abolishing contraction, also prevent optical mapping from being used to study coupling between electrical and mechanical function. Here, we present a method to simultaneously map Vm and epicardial contraction in the beating heart. Isolated perfused swine hearts were stained with di-4-ANEPPS and fiducial markers were glued to the epicardium for motion tracking. The heart was imaged at 750 Hz with a video camera. Fluorescence was excited with cyan or blue LEDs on alternating camera frames, thus providing a 375-Hz effective sampling rate. Marker tracking enabled the pixel(s) imaging any epicardial site within the marked region to be identified in each camera frame. Cyan- and blue-elicited fluorescence have different sensitivities to Vm, but other signal features, primarily motion artifacts, are common. Thus, taking the ratio of fluorescence emitted by a motion-tracked epicardial site in adjacent frames removes artifacts, leaving Vm (excitation ratiometry). Reconstructed Vm signals were validated by comparison to monophasic action potentials and to conventional optical mapping signals. Binocular imaging with additional video cameras enabled marker motion to be tracked in three dimensions. From these data, epicardial deformation during the cardiac cycle was quantified by computing finite strain fields. We show that the method can simultaneously map Vm and strain in a left-sided working heart preparation and can image changes in both electrical and mechanical function 5 min after the induction of regional ischemia. By allowing high-resolution optical mapping in the absence of electromechanical uncoupling agents, the method relieves a long-standing limitation of optical mapping and has potential to enhance new studies in coupled cardiac electromechanics.
Copyright © 2016 Biophysical Society. Published by Elsevier Inc. All rights reserved.
Figures
Comment in
-
Optical Mapping of Cardiac Electromechanics.Biophys J. 2016 Jul 26;111(2):269-270. doi: 10.1016/j.bpj.2016.04.052. Biophys J. 2016. PMID: 27463128 Free PMC article. No abstract available.
Similar articles
-
Optical mapping of cardiac electromechanics in beating in vivo hearts.Biophys J. 2023 Nov 7;122(21):4207-4219. doi: 10.1016/j.bpj.2023.09.017. Epub 2023 Sep 29. Biophys J. 2023. PMID: 37775969 Free PMC article.
-
Simultaneous optical mapping of transmembrane potential and wall motion in isolated, perfused whole hearts.J Biomed Opt. 2011 Sep;16(9):096020. doi: 10.1117/1.3630115. J Biomed Opt. 2011. PMID: 21950934 Free PMC article.
-
A novel approach to dual excitation ratiometric optical mapping of cardiac action potentials with di-4-ANEPPS using pulsed LED excitation.IEEE Trans Biomed Eng. 2011 Jul;58(7):2120-6. doi: 10.1109/TBME.2011.2148719. Epub 2011 May 2. IEEE Trans Biomed Eng. 2011. PMID: 21536528 Free PMC article.
-
Near-infrared voltage-sensitive fluorescent dyes optimized for optical mapping in blood-perfused myocardium.Heart Rhythm. 2007 Nov;4(11):1441-51. doi: 10.1016/j.hrthm.2007.07.012. Epub 2007 Jul 17. Heart Rhythm. 2007. PMID: 17954405 Free PMC article. Review.
-
Optical mapping of contracting hearts.J Physiol. 2023 Apr;601(8):1353-1370. doi: 10.1113/JP283683. Epub 2023 Mar 19. J Physiol. 2023. PMID: 36866700 Free PMC article. Review.
Cited by
-
Local Field Fluorescence Microscopy: Imaging Cellular Signals in Intact Hearts.J Vis Exp. 2017 Mar 8;(121):55202. doi: 10.3791/55202. J Vis Exp. 2017. PMID: 28362405 Free PMC article.
-
Optical mapping of cardiac electromechanics in beating in vivo hearts.Biophys J. 2023 Nov 7;122(21):4207-4219. doi: 10.1016/j.bpj.2023.09.017. Epub 2023 Sep 29. Biophys J. 2023. PMID: 37775969 Free PMC article.
-
Electromechanical vortex filaments during cardiac fibrillation.Nature. 2018 Mar 29;555(7698):667-672. doi: 10.1038/nature26001. Epub 2018 Feb 21. Nature. 2018. PMID: 29466325
-
Paralysis by analysis: Overcoming cardiac contraction with computer vision.Proc Natl Acad Sci U S A. 2023 Oct 17;120(42):e2314448120. doi: 10.1073/pnas.2314448120. Epub 2023 Oct 4. Proc Natl Acad Sci U S A. 2023. PMID: 37792520 Free PMC article. No abstract available.
-
Optical Mapping of Cardiac Electromechanics.Biophys J. 2016 Jul 26;111(2):269-270. doi: 10.1016/j.bpj.2016.04.052. Biophys J. 2016. PMID: 27463128 Free PMC article. No abstract available.
References
-
- Efimov I.R., Nikolski V.P., Salama G. Optical imaging of the heart. Circ. Res. 2004;95:21–33. - PubMed
-
- Lee M.H., Lin S.F., Chen P.S. Effects of diacetyl monoxime and cytochalasin D on ventricular fibrillation in swine right ventricles. Am. J. Physiol. Heart Circ. Physiol. 2001;280:H2689–H2696. - PubMed
-
- Qin H., Kay M.W., Rogers J.M. Effects of heart isolation, voltage-sensitive dye, and electromechanical uncoupling agents on ventricular fibrillation. Am. J. Physiol. Heart Circ. Physiol. 2003;284:H1818–H1826. - PubMed
MeSH terms
Grants and funding
LinkOut - more resources
Full Text Sources
Other Literature Sources
