. 2016 Jul 27;12(7):e1005777.
doi: 10.1371/journal.ppat.1005777. eCollection 2016 Jul.

Altered Memory Circulating T Follicular Helper-B Cell Interaction in Early Acute HIV Infection

Affiliations

Altered Memory Circulating T Follicular Helper-B Cell Interaction in Early Acute HIV Infection

Roshell Muir et al. PLoS Pathog. .

Abstract

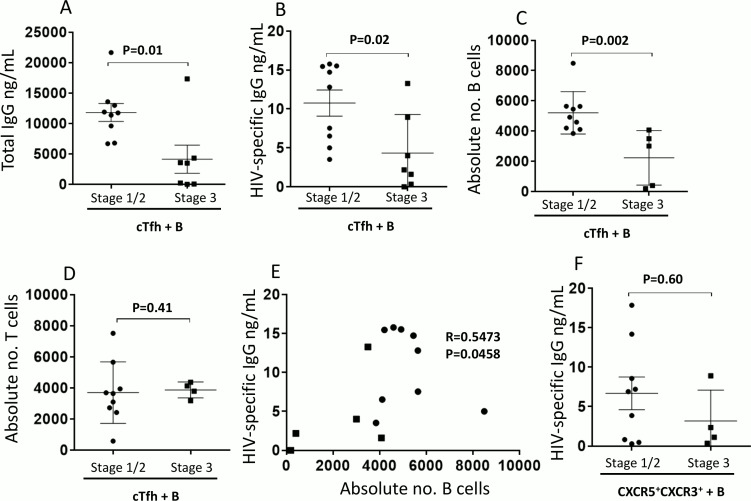
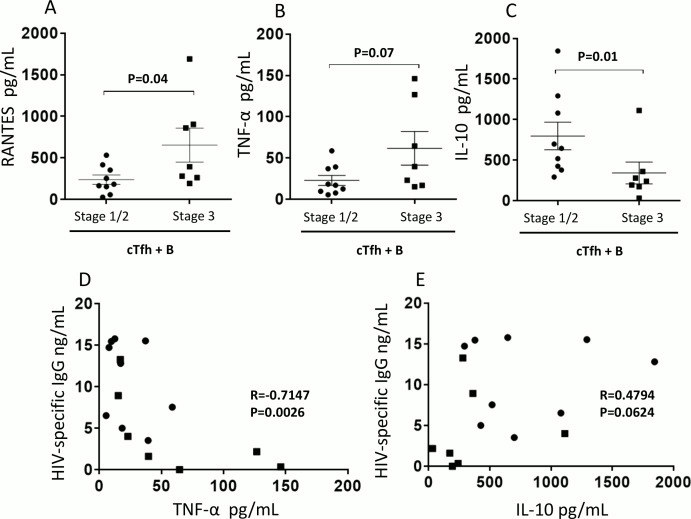
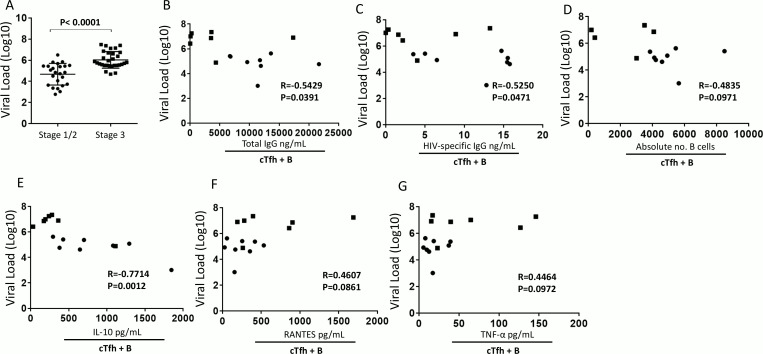
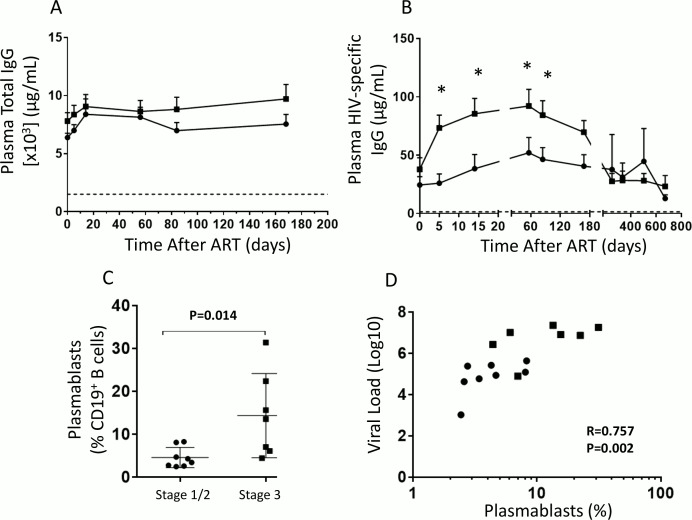
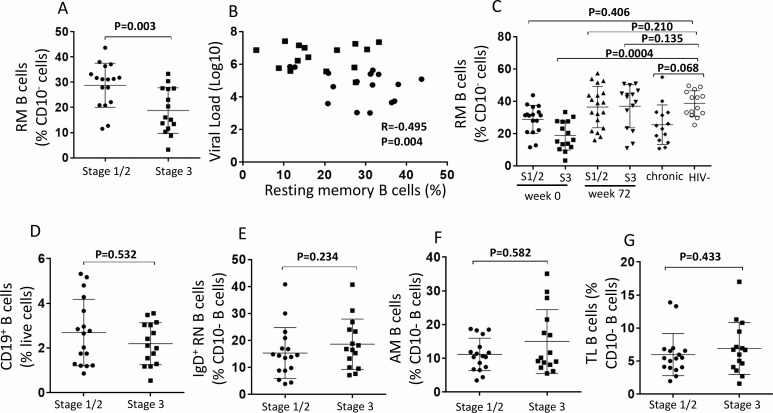
The RV254 cohort of HIV-infected very early acute (4thG stage 1 and 2) (stage 1/2) and late acute (4thG stage 3) (stage 3) individuals was used to study T helper- B cell responses in acute HIV infection and the impact of early antiretroviral treatment (ART) on T and B cell function. To investigate this, the function of circulating T follicular helper cells (cTfh) from this cohort was examined, and cTfh and memory B cell populations were phenotyped. Impaired cTfh cell function was observed in individuals treated in stage 3 when compared to stage 1/2. The cTfh/B cell cocultures showed lower B cell survival and IgG secretion at stage 3 compared to stage 1/2. This coincided with lower IL-10 and increased RANTES and TNF-α suggesting a role for inflammation in altering cTfh and B cell responses. Elevated plasma viral load in stage 3 was found to correlate with decreased cTfh-mediated B cell IgG production indicating a role for increased viremia in cTfh impairment and dysfunctional humoral response. Phenotypic perturbations were also evident in the mature B cell compartment, most notably a decrease in resting memory B cells in stage 3 compared to stage 1/2, coinciding with higher viremia. Our coculture assay also suggested that intrinsic memory B cell defects could contribute to the impaired response despite at a lower level. Overall, cTfh-mediated B cell responses are significantly altered in stage 3 compared to stage 1/2, coinciding with increased inflammation and a reduction in memory B cells. These data suggest that early ART for acutely HIV infected individuals could prevent immune dysregulation while preserving cTfh function and B cell memory.


Conflict of interest statement

I have read the journal's policy and the authors of this manuscript have the following competing interests: JA has received honoraria from Merck, ViiV Healthcare and Tetralogic for her participation in advisory meetings. The other authors have declared that no competing interests exist.

Figures

Fig 1
Fig 1. cTfh-mediated memory B cell help is impaired in late stage acute HIV-infected individuals.
PBMCs from week 0 stage 1/2 (n = 9) and stage 3 (n = 4–7) individuals were sorted. cTfh (CD3+CD4+CD45RA-CXCR5+CXCR3-) or the less efficient T-helper cells (CD3+CD4+CD45RA-CXCR5+CXCR3+) denoted CXCR5+CXCR3+ were placed in culture with autologous resting memory B cells (CD19+CD10-CD21+CD27+) in the presence of SEB. Quantification of cTfh-mediated B cell help was carried out by measuring (A) total and (B) HIV-specific IgG ELISA in 7 day culture supernatant. Absolute numbers of live (C) B and (D) T cells were quantified. (E) Correlation analysis was carried out between the absolute number of B cells and HIV-specific IgG. (F) HIV-specific IgG ELISA in 7 day culture supernatant from cultures of CXCR5+CXCR3+ T cells and memory B cells was also quantified. For (A)-(D) and (F) bars represent mean ±SD. Symbols on the graphs represent stage 1/2 individuals (black circles) and stage 3 individuals (black squares) and statistics were carried out using the Mann-Whitney non-parametric test. For (E) symbols represent stage 1/2 individuals (black circles) and stage 3 individuals (black squares) and correlation data was analyzed using Spearman r test. * P< 0.05. Results were significant if P < 0.05.
Fig 2
Fig 2. IL-10 and TNF-α levels in cocultures of cTfh and B cells from late stage acute individuals influence HIV-specific IgG production.
Cocultures of cTfh and autologous resting memory B cells from week 0 stage 1/2 (n = 9) and stage 3 (n = 7) individuals were analyzed for the presence of cytokines including (A) RANTES, (B) TNF-α and (C) IL-10. Correlation analysis was carried out between (D) TNF-α; (E) IL-10 and HIV-specific IgG. For (A)-(C) bars represent mean ±SD. Symbols on the graphs represent stage 1/2 individuals (black circles) and Stage 3 individuals (black squares) and statistics were carried out using the Mann-Whitney non-parametric test. For (D) and (E) symbols represent stage 1/2 individuals (black circles) and stage 3 individuals (black squares) and correlation data was analyzed using Spearman r test. * P< 0.05.
Fig 3
Fig 3. Elevated plasma viral load is associated with reduction in the cTfh-dependent humoral response.
(A) Viral load was quantified in the plasma from stage 1/2 (n = 24) and from stage 3 (n = 30) HIV-infected individuals at day 0 prior to ART initiation. Correlation analysis was carried out between plasma viral load at day 0 and cTfh and memory 7 day culture supernatant (B) -Total IgG, (C) -HIV-specific IgG, (D) absolute number of B cells, (E) IL-10, (F) RANTES and (G) TNF-α from stage 1/2 (n = 8) and stage 3 (n = 5–7). For (A) bars represent mean SD, symbols on the graphs represent stage 1/2 individuals (black circles) and stage 3 individuals (black squares) and statistics were carried out using the Mann-Whitney non-parametric test. For (B)-(G) symbols represent stage 1/2 individuals (black circles) and stage 3 individuals (black squares) and correlation data was analyzed using Spearman r test.* P < 0.05.
Fig 4
Fig 4. Elevated plasma viral load is also associated with a T cell-independent hyperactivated B cell response.
Plasma at day 0 and days 5, 14, 56, 84, 168, 252, 336, 504 and 672 of ART, were analyzed by ELISA for (A) Total IgG and (B) HIV-specific IgG. PBMCs from week 0 Stage 1 and 2 (n = 8) and Stage 3 (n = 7) patients were analyzed by flow cytometry for terminally differentiated plasmablasts identified as CD19+CD10-CD20-CD21-CD38hiCD27hi cells. (C) Plasmablasts from stage 1/2 and stage 3 were compared to each other and (D) together with plasma viral load. For graphs (A) and (B) bars represent mean SEM and statistics were carried out using multiple T tests comparing stage 1/2 to stage 3 at the different time points. Symbols on the graphs represent Stage 1/2 individuals (black circles) and Stage 3 individuals (black squares). For (C) bars represent mean ±SD, symbols on the graphs represent stage 1/2 individuals (black circles) and stage 3 individuals (black squares) and statistics carried out using the Mann-Whitney non-parametric test. For (D) symbols represent stage 1/2 individuals (black circles) and stage 3 individuals (black squares) and correlation data was analyzed using Spearman r test. * P < 0.05.
Fig 5
Fig 5. Impact of early acute HIV infection on blood memory B cell subsets.
PBMCs from week 0 stage 1/2 (n = 17) and stage 3 (n = 16) patients were analyzed by flow cytometry for resting memory (RM) B cells CD19+CD10-CD21+CD27+ and (A) compared with each other and (B) with plasma viral load. (C) Comparisons were also done with PBMCs from week 72 of ART (W72) (n = 19 and n = 18 respectively), chronic HIV infected patients (n = 14) and HIV negative patients (n = 14). PBMCs from week 0 stage 1/2 (n = 17) and stage 3 (n = 16) patients were analyzed by flow cytometry for (D) Total B cells which were identified as CD19+; (E) resting naïve (RN) B cells CD19+CD10-CD21+CD27-IgD+ (F) activated memory (AM) B cells CD19+CD10-CD21-CD27+ cells, (G) Tissue-like (TL) B cells CD19+CD10-CD21-CD27-. For (A) and (E)-(H), bars represent mean ±SD. Symbols on the graphs represent stage 1/2 individuals (black circles) and stage 3 individuals (black squares). Statistics were carried out using the Mann-Whitney non-parametric test. For (B) symbols represent stage 1/2 individuals (black circles) and stage 3 individuals (black squares) and correlation data was analyzed using Spearman r test. * P < 0.05. For (C), symbols represent individuals from week 0 stage 1/2 (black circles), week 0 stage 3 (black squares), week 72 ART stage 1/2 (upward pointing black triangles), week 72 ART stage 3 (downward pointing black triangles), chronic individuals (black diamonds) and HIV negative (open circles). Statistics were carried out using Kruskal-Wallis multiple comparison test. * P< 0.05.

References

    1. Altfeld M, Rosenberg ES, Shankarappa R, Mukherjee JS, Hecht FM, Eldridge RL, et al. Cellular immune responses and viral diversity in individuals treated during acute and early HIV-1 infection. J Exp Med. 2001;193(2):169–80. - PMC - PubMed
    1. Cellerai C, Harari A, Stauss H, Yerly S, Geretti AM, Carroll A, et al. Early and prolonged antiretroviral therapy is associated with an HIV-1-specific T-cell profile comparable to that of long-term non-progressors. PLoS One. 2011;6(4):e18164 10.1371/journal.pone.0018164 - DOI - PMC - PubMed
    1. Ananworanich J, Dube K, Chomont N. How does the timing of antiretroviral therapy initiation in acute infection affect HIV reservoirs? Curr Opin HIV AIDS. 2015;10(1):18–28. 10.1097/COH.0000000000000122 - DOI - PMC - PubMed
    1. Altfeld M, Walker BD. Less is more? STI in acute and chronic HIV-1 infection. Nat Med. 2001;7(8):881–4. 10.1038/90901 . - DOI - PubMed
    1. Daucher M, Price DA, Brenchley JM, Lamoreaux L, Metcalf JA, Rehm C, et al. Virological outcome after structured interruption of antiretroviral therapy for human immunodeficiency virus infection is associated with the functional profile of virus-specific CD8+ T cells. J Virol. 2008;82(8):4102–14. 10.1128/JVI.02212-07 - DOI - PMC - PubMed

Publication types

Substances