. 2016 Dec;15(6):1039-1050.
doi: 10.1111/acel.12506. Epub 2016 Jul 27.

Prelamin A impairs 53BP1 nuclear entry by mislocalizing NUP153 and disrupting the Ran gradient

Affiliations

Prelamin A impairs 53BP1 nuclear entry by mislocalizing NUP153 and disrupting the Ran gradient

Andrew M Cobb et al. Aging Cell. 2016 Dec.

Abstract

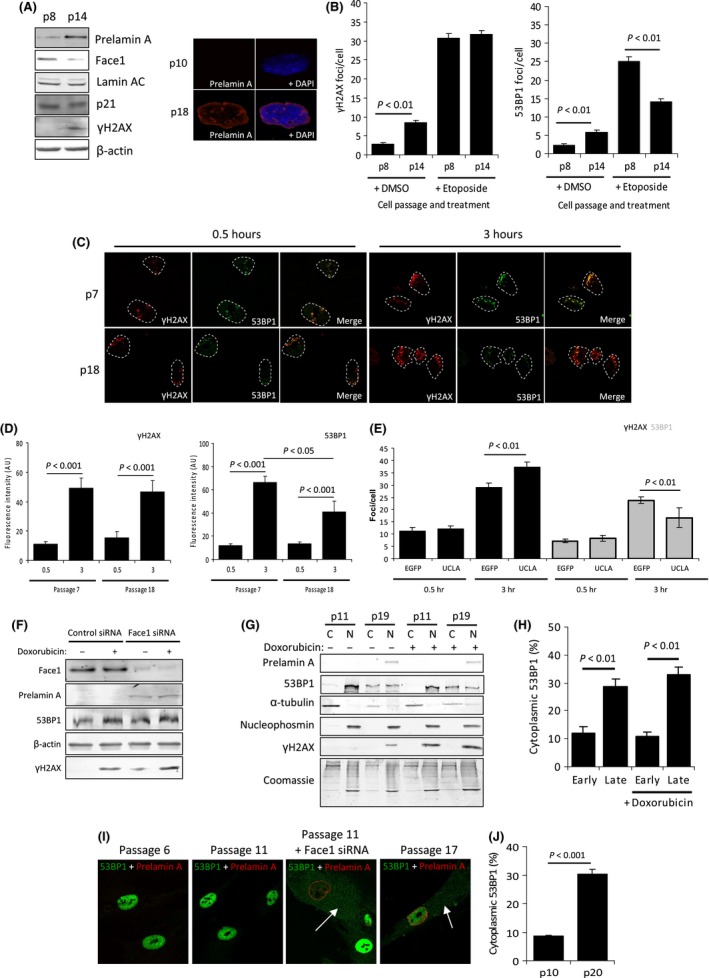
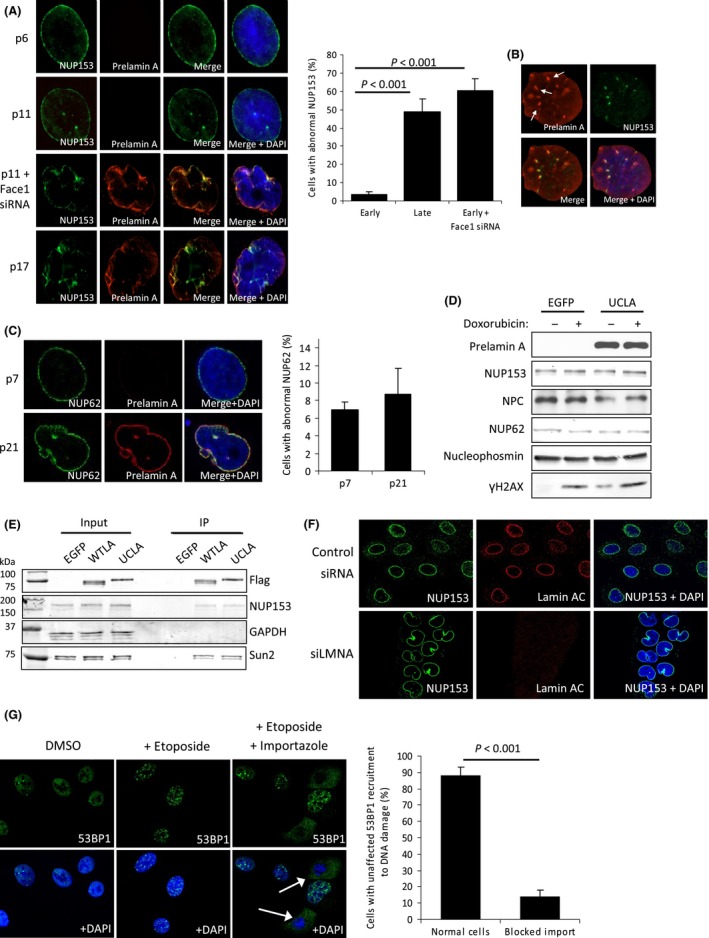
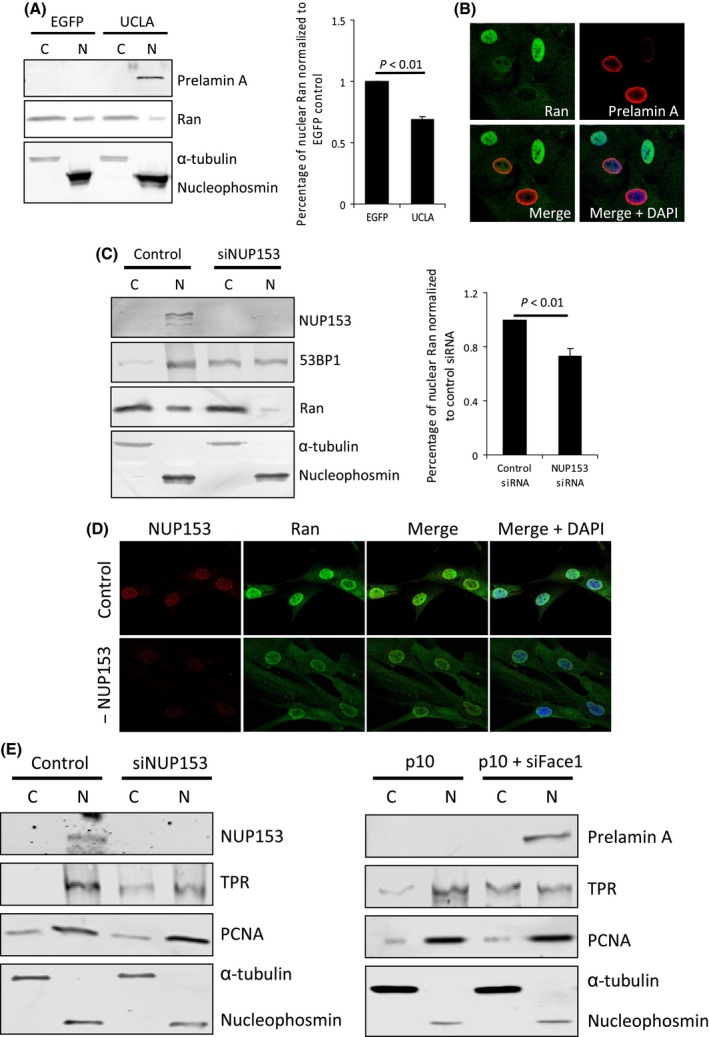
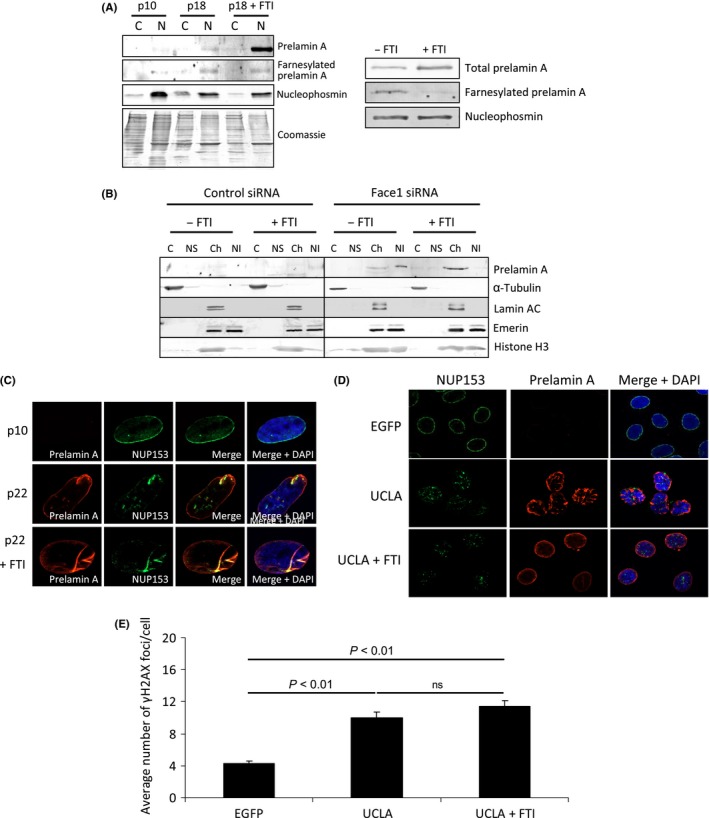
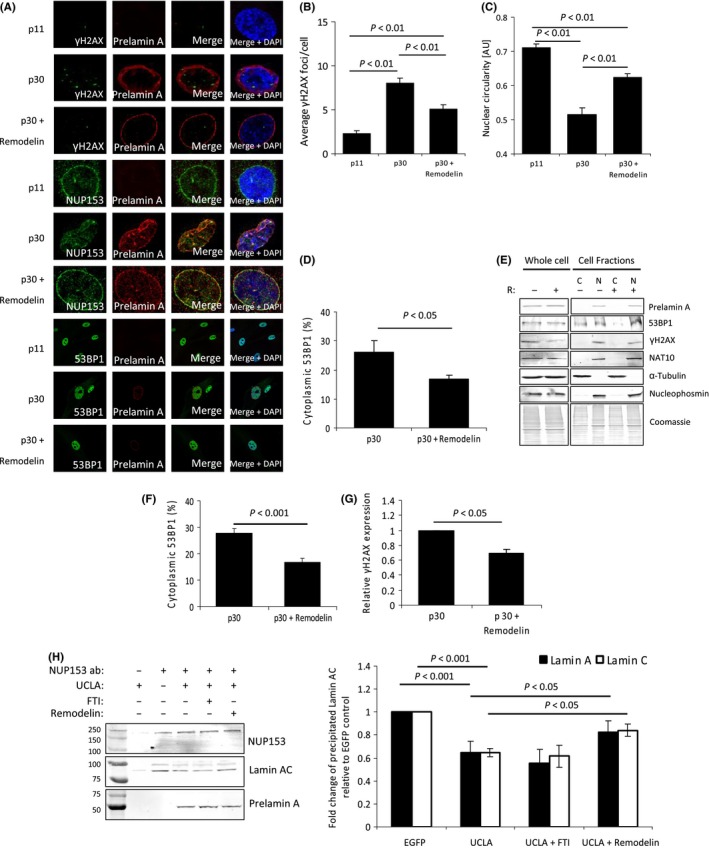
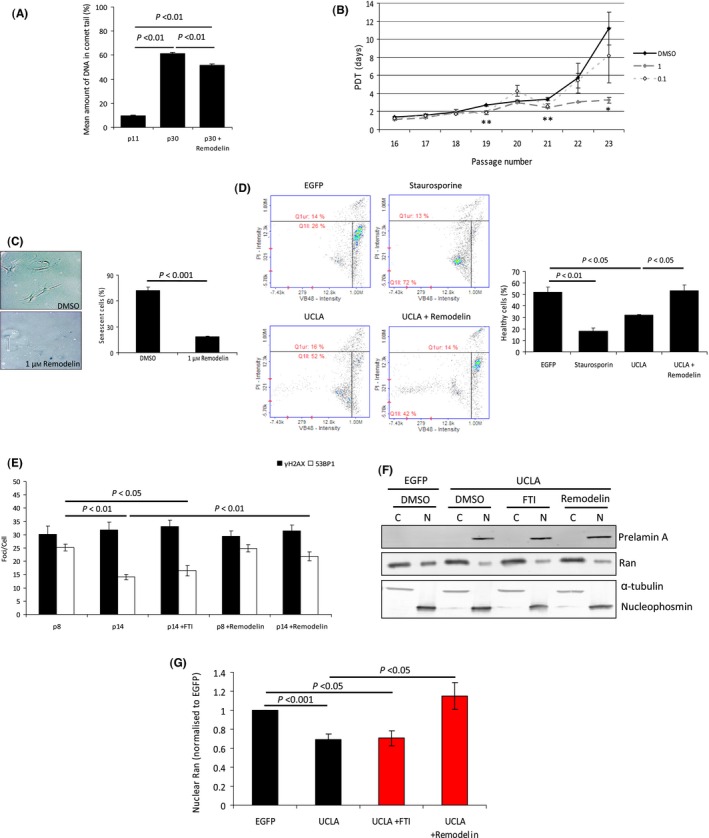
The nuclear lamina is essential for the proper structure and organization of the nucleus. Deregulation of A-type lamins can compromise genomic stability, alter chromatin organization and cause premature vascular aging. Here, we show that accumulation of the lamin A precursor, prelamin A, inhibits 53BP1 recruitment to sites of DNA damage and increases basal levels of DNA damage in aged vascular smooth muscle cells. We identify that this genome instability arises through defective nuclear import of 53BP1 as a consequence of abnormal topological arrangement of nucleoporin NUP153. We show for the first time that this nucleoporin is important for the nuclear localization of Ran and that the deregulated Ran gradient is likely to be compromising the nuclear import of 53BP1. Importantly, many of the defects associated with prelamin A expression were significantly reduced upon treatment with Remodelin, a small molecule recently reported to reverse deficiencies associated with abnormal nuclear lamina.

Keywords: 53BP1; NUP153; Ran gradient; cytoplasmic-nuclear trafficking; prelamin A; vascular disease.


Figures

Figure 1
Figure 1
Prelamin A in aged VSMCs prevents 53BP1 recruitment to DNA damage by inducing cytoplasmic accumulation. (A) (Left) WB showing increased prelamin A in aged (p14) VSMCs compared to early (p8) VSMCs that occurs concomitantly with a decrease in Face1. Levels of mature lamin AC and p21 are not markedly different, whereas γH2AX is increased. The data shown are from 35F VSMC isolate, but we also detect prelamin A accumulation and increased γH2AX in two other VSMC isolates (Fig. S1). All experiments were repeated a minimum of 3 times. (Right) IF image of a proliferative early passage (p10) VSMC and a nonproliferative late passage (p18) VSMC stained for prelamin A (red) and DAPI (blue). (B) Enumeration of γH2AX (left) and 53BP1 (right) foci in p8 and p14 VSMCs treated with DMSO or etoposide. > 200 cells per treatment taken from 3 independent experiments. Standard errors are shown. (C) IF showing γH2AX (red) and 53BP1 (green) in p7 and p18 VSMCs treated with microirradiation and left to recover for 0.5 or 3 h. About 84% of p18 VSMCs were positive for prelamin A, and no prelamin A was detected in p7 VSMCs (data not shown). (D) Quantification of C. > 100 cells per treatment taken from 3 independent experiments. (E) IF analysis of γH2AX and 53BP1 foci in p8 control (EGFP) or expressing prelamin A (UCLA) VSMCs treated with etoposide for 3 h. = 200 cells per treatment taken from 3 independent experiments. (F) Whole cell lysate WB taken from early passage VSMCs treated with control or Face1 siRNA and −/+ doxorubicin treatment. Levels of prelamin A were increased, but total 53BP1 protein level did not change. (G) WB of cell fractionation analysis showing cytoplasmic 53BP1 accumulates in p19 VSMCs and that this coincides with prelamin A expression (not seen in p11 VSMCs). α‐tubulin and nucleophosmin are shown as controls for cytoplasmic (C) and nuclear (N) fractions, respectively. Doxorubicin did not affect this accumulation. (H) Quantification of G. Data were taken from a minimum of 3 separate experiments. (I) IF of 53BP1 (green) cytoplasmic accumulation in VSMCs that have accumulated prelamin A (red). p6 and p11 VSMCs had undetectable levels of prelamin A, but induced expression of Prelamin A with Face1 siRNA (third panel) caused an increase in levels of cytoplasmic 53BP1 and reduced nuclear levels. This change is also evident in p17 VSMCs that have naturally accumulated prelamin A. White arrows indicate cytoplasmic 53BP1. Nuclei have been stained with DAPI. (J) Quantification of fluorescence measurements of cytoplasmic and nuclear 53BP1 in p10 and p20 VSMCs. > 100 cells from 3 separate experiments.
Figure 2
Figure 2
Prelamin A accumulation in aged VSMCs induces NUP153 mislocalization. (A) (Left) IF of NUP153 (green) and prelamin A (red) in passages 6, 11, 11 + Face1 siRNA and 17. DNA is stained with DAPI. Prelamin A results in nucleoplasmic aggregation of NUP153 and its loss at the NE. (Right) Quantification of incidence of abnormal NUP153. > 300 cells from 3 separate experiments, standard errors are shown. (B) IF of a p11 VSMC nuclei that was induced to express Flag‐tagged prelamin A. NUP153 (green) and prelamin A (red) colocalization is shown by white arrows. DNA is stained with DAPI. (C) (Left) IF analysis of NUP62 (green) in p7 and p21 VSMCs. Despite prelamin A‐induced deformation of the nuclei, most NUP62 is retained at the NE. DAPI is shown. (Right) Quantitative analysis of cells displaying abnormal NUP153, > 200 cells from 3 independent experiments. (D) WB of nucleoporin protein levels in early passage VSMCs expressing EGFP or prelamin A (UCLA). No marked differences were observed. (E) WB showing example from Flag precipitation experiments used to assess NUP153 interactions with mature wild‐type lamin A (WTLA) and prelamin A (UCLA). EGFP was used as a negative control. Assays revealed NUP153 was precipitated when either WTLA or UCLA were used as bait. (F) IF showing depletion of lamin AC (red) using siLMNA induces changes in nuclear morphology but does not cause loss of NUP153 (green) from the NE. DNA is stained with DAPI (blue). (G) (Left) IF of cells treated with Importazole for 24 h to block importin‐β‐mediated import of 53BP1 (green). Cells exhibited attenuation of nuclear 53BP1 foci after etoposide treatment, reinforcing the importance of nuclear import of 53BP1 for its activity. (Right) Quantification of cells treated with etoposide and Importazole. Foci formation of 53BP1 was compared in cells that displayed no cytoplasmic 53BP1 accumulation (normal cells) and those showing increased cytoplasmic 53BP1 (blocked import). Cells with >5 53BP1 foci were considered to have unaffected 53BP1 recruitment. > 150 cells from 3 separate experiments, standard errors are shown.
Figure 3
Figure 3
The Ran gradient is disrupted by prelamin A expression or depletion of NUP153. (A) (Left) WB of p10 VSMC cytoplasmic (C) and nuclear (N) fractions following EGFP or UCLA expression. α‐tubulin (cytoplasmic) and nucleophosmin (nuclear) are shown as loading controls. Quantification of Ran from 3 independent experiments (standard errors are shown) (Right). (B) IF image of Ran (green) in p10 VSMCs expressing EGFP or UCLA. Prelamin A (red) and DAPI (blue) are shown. (C) (Left) WB of p10 VSMC cytoplasmic (C) and nuclear (N) fractions following control or NUP153 siRNA treatment and ensuing cytoplasmic accumulation of 53BP1. α‐tubulin (cytoplasmic) and nucleophosmin (nuclear) are shown as loading controls. (Right) Quantification of Ran from 3 independent experiments. (D) IF of Ran (green) in p10 VSMCs treated with control or NUP153 siRNA. DAPI is shown in blue. (E) (Left) WB showing NUP153 depletion can affect nuclear localization of TPR but not PCNA in p9 VSMCs. (Right) WB showing Face1 depletion in p10 VSMCs induces similar cytoplasmic accumulation of TPR.
Figure 4
Figure 4
FTIs improve prelamin A‐induced dysmorphic nuclei but do not recover NUP153 localization or genome stability. (A) (Left) WB showing prelamin A that accumulates naturally in aged VSMCs (p18) is farnesylated using an antibody specific for farnesylated prelamin A. Cells were fractionated into cytoplasmic (C) and nuclear (N) compartments to concentrate proteins. FTIs significantly increase levels of total prelamin A, but this increase is not detected with the farnesylated prelamin A‐specific antibody. (Right) WB of U2OS cells expressing UCLA. Cells had been treated with or without FTI‐276 for 48 h prior to harvesting. Protein was probed using antibodies against total prelamin A or specific for farnesylated prelamin A. (B) WB of biochemical fractionated U2OS cells treated with control or Face1 siRNA and −/+ FTIs. C – cytoplasmic, NS – nuclear soluble, Ch – chromatin and NI – nuclear insoluble. Prelamin A is tightly associated with the NE and remains in the nuclear fraction unlike the more soluble lamin A/C. FTIs release prelamin A from the insoluble fraction. (C) IF of NUP153 (green) localization in p10 and p22 VSMCs −/+ FTIs. Prelamin A (red) and DNA (blue) are also shown. (D) IF showing NUP153 (green) and prelamin A (red) in U2OS cells expressing either EGFP or UCLA −/+ FTIs. DAPI (blue) is also shown. (E) Enumeration of γH2AX in VSMCs expressing EGFP, UCLA alone or UCLA + FTI treatment. > 200 cells were analysed from 3 independent experiments, and average number of γH2AX foci per cell was calculated. Standard errors are shown.
Figure 5
Figure 5
Remodelin reverses prelamin A‐dependent defects in aged VSMCs. (A) IF of p11, p30 and p30 +Remodelin VSMCs. Cells were stained for γH2AX, NUP153 and 53BP1 (all green) in addition to prelamin A (red) and DAPI (blue). Panels showing 53BP1 staining show cells at a reduced magnification to allow visualization of staining in cell cytoplasmic regions. (B) Quantification of average number of γH2AX in p11, p30 and p30 + Remodelin VSMCs. > 100 cells were counted per cell group from 3 independent experiments. Standard errors are shown. (C) Nuclear circularity of p11, p30 and p30 + Remodelin VSMCs. Values closer to 1 indicate nuclei that are more circular. > 100 cells from more than 3 independent experiments. (D) Fluorescence intensity measurements of cytoplasmic 53BP1 in p30 and p30 + Remodelin VSMCs. Readings for nuclear and cytoplasmic were obtained, and percentage cytoplasmic values were calculated. > 100 cells from 3 independent experiments. (E) WB of whole cell and cell fractions (cytoplasmic – C, nuclear – N) of p30 VSMCs −/+ Remodelin (R). (F) Quantification of 53BP1 bands shown in D. Data are from 3 separate experiments. (G) Quantification of γH2AX bands shown in D. Data are from 3 separate experiments (H) (Left) Co‐immunoprecipitation WB using NUP153 as bait with lamin AC and prelamin A as target interactors. Assays were performed in U2OS cells expressing UCLA −/+FTIs and −/+ Remodelin. Prelamin A acted as a competitor against lamin AC to bind to NUP153, but this was alleviated to an extent by addition of Remodelin. (Right) Quantification of lamin A and C precipitation. Band intensities of precipitated lamin AC were measured and normalized to total input lamin AC. Fold changes of precipitated lamin AC in UCLA, UCLA + FTI and UCLA + Remodelin were then calculated relative to EGFP control cells. = 4, standard errors are shown.
Figure 6
Figure 6
Remodelin improves cell fitness of late passage VSMCs and improves Ran gradient defects associated with prelamin A expression. (A) Comet assay of p12, p30 and p30 + Remodelin VSMCs. > 100 cells per group were analysed from 4 independent experiments. Standard errors are shown. (B) Cell population doubling time (PDT) analysis of mid–late passage VSMCs treated with DMSO, 1 or 0.1 μm Remodelin. No differences were detected between DMSO and 0.1 μm Remodelin‐treated cells, but 1 μm Remodelin‐treated cells retained low PDTs for longer and grew significantly faster at passages 19, 21 and 23 (*P < 0.05, **P < 0.01). Data were from 3 independent experiments. (C) (Left) Representative image of senescence‐associated β‐galactosidase assay of p23 VSMCs treated with DMSO or 1 μm Remodelin from PDT experiment shown in B. Senescent cells are indicated by blue staining. (Right) Quantification of senescent cells. A minimum of 200 cells were counted from 3 experiments. (D) Cell vitality analysis of p11 VSMCs expressing EGFP, UCLA or UCLA+Remodelin. As a positive control for apoptosis initiation, cells were treated with Staurosporine. (Left) Representative plots from assay. (Right) Quantification of healthy cells from 3 independent experiments. (E) Enumeration of γH2AX and 53BP1 foci in p8 and p14 VSMCs treated with etoposide and −/+ FTI or Remodelin. Counts were from >200 cells from 3 independent experiments. (F) Representative WB of cytoplasmic (C) and nuclear (N) fractions from p10 VSMCs expressing EGFP or UCLA and treated with DMSO, FTIs or Remodelin. Prelamin A expression reduces levels of nuclear Ran, and this can be recovered to an extent by Remodelin. (G) Quantification of Ran band intensities shown in G. Measurements were taken from 3 separate experiments. Standard errors are shown. Bars in red indicate additional data added to data presented in Fig. 3A.

Similar articles

Cited by

References

    1. Al‐Haboubi T, Shumaker DK, Koser J, Wehnert M, Fahrenkrog B (2011) Distinct association of the nuclear pore protein Nup153 with A‐ and B‐type lamins. Nucleus 2, 500–509. - PubMed
    1. Barrowman J, Hamblet C, Kane MS, Michaelis S (2012) Requirements for efficient proteolytic cleavage of prelamin A by ZMPSTE24. PLoS ONE 7, e32120. - PMC - PubMed
    1. Coutinho HD, Falcao‐Silva VS, Goncalves GF, da Nobrega RB (2009) Molecular ageing in progeroid syndromes: Hutchinson‐Gilford progeria syndrome as a model. Immun. Ageing 6, 4. - PMC - PubMed
    1. Datta S, Snow CJ, Paschal BM (2014) A pathway linking oxidative stress and the Ran GTPase system in progeria. Mol. Biol. Cell 25, 1202–1215. - PMC - PubMed
    1. Davies BS, Coffinier C, Yang SH, Barnes RH II, Jung HJ, Young SG, Fong LG (2011) Investigating the purpose of prelamin A processing. Nucleus 2, 4–9. - PMC - PubMed

LinkOut - more resources