. 2016 Jul 28:7:12254.
doi: 10.1038/ncomms12254.

The transcriptional coregulator GRIP1 controls macrophage polarization and metabolic homeostasis

Affiliations

The transcriptional coregulator GRIP1 controls macrophage polarization and metabolic homeostasis

Maddalena Coppo et al. Nat Commun. .

Abstract

Diet-induced obesity causes chronic macrophage-driven inflammation in white adipose tissue (WAT) leading to insulin resistance. WAT macrophages, however, differ in their origin, gene expression and activities: unlike infiltrating monocyte-derived inflammatory macrophages, WAT-resident macrophages counteract inflammation and insulin resistance, yet, the mechanisms underlying their transcriptional programming remain poorly understood. We recently reported that a nuclear receptor cofactor-glucocorticoid receptor (GR)-interacting protein (GRIP)1-cooperates with GR to repress inflammatory genes. Here, we show that GRIP1 facilitates macrophage programming in response to IL4 via a GR-independent pathway by serving as a coactivator for Kruppel-like factor (KLF)4-a driver of tissue-resident macrophage differentiation. Moreover, obese mice conditionally lacking GRIP1 in macrophages develop massive macrophage infiltration and inflammation in metabolic tissues, fatty livers, hyperglycaemia and insulin resistance recapitulating metabolic disease. Thus, GRIP1 is a critical regulator of immunometabolism, which engages distinct transcriptional mechanisms to coordinate the balance between macrophage populations and ultimately promote metabolic homeostasis.


Figures

Figure 1
Figure 1. GRIP1 is required for M(IL4) polarization.
(a) GRIP1 deletion attenuates Klf4 mRNA induction during IL4-induced macrophage activation. WT and cKO BMDM were activated with IL4 (20 ng ml−1, 18 h) followed by treatment with Dex (100 nM, 30 min) and Klf4 expression was assessed by RT-qPCR using β-actin as an internal normalization control. Klf4 transcript levels in BMDM not exposed to IL4 were set to 1 for each genotype; n=3/group, error bars are s.d. Student's t-test was used to determine significance. (b) A subset of genes differentially expressed in unstimulated [M(con)] versus IL4-activated [M(IL4)] BMDM as detected by RNAseq. (c) Lack of GRIP1 impairs the expression of a subset M(IL4) polarization-associated genes. Gene expression was assessed by RT-qPCR as in a and compared using the Mann–Whitney test. n>6 per group; error bars are s.e.m. (d) GRIP1-deficient M(IL4) express less KLF4, PPARγ and ARG1 proteins. M(con) and M(IL4) WCE were analysed for the expression of indicated proteins by immunoblotting with vinculin as a loading control. Shown is a representative of 2–3 blots (see Supplementary Fig. 1 for quantitation of multiple experiments and a full size KLF4 blot). (e,f) IL4-mediated STAT6 activation is intact in GRIP1 cKO macrophages. WT and cKO BMDM were incubated with IL4 for indicated times and the level of total and Tyr641-phosphorylated STAT6 in WCE was assessed by immunoblotting (e). STAT6 target gene expression in WT and cKO macrophages incubated with IL4 for indicated times was assessed by RT-qPCR as in a. n=3/group; error bars are s.e.m. (f). (g,h) The importance of GRIP1 for Klf4 induction is mouse strain-independent. GRIP1 LysM-Cre cKO and matching WT mice were produced as described in Methods section and Supplementary Fig. 3. M(con) and M(IL4) were generated and the expression of Grip1 (g) and Klf4 (h) were assessed by RT-qPCR as in a; normalized Grip1 transcript level is set to 1 in WT M(con); normalized Klf4 transcript level is set to 1 in M(con) of each genotype; n=4/group; error bars are s.d. Student's t-test was used to determine significance. GRIP1 protein expression in WT and GRIP1 LysM-Cre cKO M(con) was assessed by immunoblotting with vinculin as a loading control.
Figure 2
Figure 2. GRIP1 interacts with KLF4 in vivo and in vitro.
(a) GRIP1 and Flag-tagged KLF4 were overexpressed in 293T cells, and WCE were immunoprecipitated (IP) with antibodies to Flag, GRIP1 or normal anti-rabbit IgG, as indicated. Proteins were detected by immunoblotting (IB) using anti-GRIP1 and anti-Flag antibodies. (b) Endogenous GRIP1 and KLF4 interact in J774A.1 cells. Cells were treated as shown and WCE were immunoprecipitated with anti-GRIP1 or anti-rabbit IgG. GRIP1 and KLF4 were detected by immunoblotting. To visualize GRIP1 in WCE, a longer exposure of the blot is shown. (c) Diagrammed are the full-length GRIP1 or truncated mutants used in the interaction assay. Basic HLH-PAS domain, repression domain (RD), AD1 and 2 and NR-interacting ‘boxes' are marked. (d) The N-terminal region of GRIP1 physically interacts with KLF4 in vitro. Indicated GRIP1 derivatives (c) and a full-length SRC1 were in vitro transcribed and translated in the presence of [35S]-methionine and incubated with the bacterially expressed full-length His-tagged KLF4 immobilized on metal-affinity resin. The top panel shows autoradiography of inputs, and bound derivatives; Coomassie blue stained His-KLF4 is shown at the bottom. (e) GRIP1 is recruited to KLF4 target genes in M(IL4). The recruitment of KLF4 and GRIP1 to KLF binding sites of Arg1 and Klf4 was assessed by ChIP in M(con) and M(IL4) as described in Methods section. As control (right panel), M(con) were treated with 100 nM Dex for 40 min, as indicated, and GRIP1 occupancy was evaluated by ChIP at the KLF4-binding site of Arg1 or at the GRE of Fkbp5. For each site, shown are mean±s.d. of three or more independent experiments.
Figure 3
Figure 3. GRIP1 deficiency in macrophages promotes HFD-induced inflammation in WAT in vivo.
(a) FA uptake is impaired in GRIP1-deficient M(IL4). FA uptake was measured 6 min post-FA addition and expressed in relative fluorescence units (RFU). n>5 per group; error bars are s.d.; Student's t-test was used to determine significance. (b) WT and GRIP1 cKO gain similar amount of body weight. Shown are averages of 9 mice per group for chow-fed mice and 7 WT and 5 cKO mice per group for HFD-fed mice. (c) eWAT weight in WT and cKO after 20 weeks of chow or HFD. eWAT weight is expressed as percentage of total body weight for each mouse; n>10 per group. Significance was determined using ANOVA followed by Tukey's HSD test. The F-statistic and the P value for the significant main effect are shown (Methods section, Supplementary Fig. 4a and Supplementary Table 1 for detailed statistics). (d) Haematopoietic cell infiltration in cKO eWAT following HFD. eWAT was fixed in 4% PFA, paraffin-embedded and subjected to H&E staining or F4/80 immunohistochemistry. Magnification is × 40. (e) Augmented expression of inflammatory mediators in eWAT of the HFD-fed GRIP1 cKO. Gene expression was assessed by RT-qPCR with Hprt for normalization. n>5 per group; error bars are s.d. The Mann–Whitney test was used to determine significance. (f) SVF cells from HFD-fed GRIP1 cKO show increased expression of macrophage and inflammatory markers. Gene expression in WT and cKO SVF was assessed as in e. n=3/group; error bars are s.d. (g) GRIP1 cKO SVF shows increased macrophage abundance. The percentage of CD45+F4/80+CD11b+ macrophages in the SVF of WT and cKO mice and frequencies of the sorted CD11c+ (CD45+F4/80+CD11b+CD206-) and CD206+ (CD45+F4/80+CD11b+CD11c-) macrophages were quantified by FACS using FlowJo software. n=5/group; values are mean±s.e.m. The Mann–Whitney test was used to determine significance. (h) GRIP1 cKO ATMΦ display an exaggerated inflammatory profile. The expression of indicated genes in CD11c+ and CD206+ populations from g was assessed as in e. n>4 per group; error bars are s.d. Student's t-test was used to determine significance. (i) Efficient deletion of Ncoa2 (GRIP1) in CD11c+ macrophages of cKO mice. RNAseq shows read distribution across Ncoa2 exons 8–11 and a complete deletion of Ex11. (j) GSEA in WAT-derived CD11c+ macrophages shows upregulation in cKO versus WT of multiple gene signatures related to inflammatory response and interferon signalling. Shown are top gene enrichment profiles with corresponding FDR q.
Figure 4
Figure 4. GRIP1 cKO HFD-fed mice develop liver inflammation and steatosis.
(a) Liver weight in WT and cKO mice after 20 weeks of chow or HFD. All liver weights are expressed as per cent of total body weight; n>10 per group. The statistical significance of differences was determined using ANOVA following Tukey's HSD test. The F-statistic and the P value for the significant main effect are shown above the panel (see Methods section, Supplementary Fig. 4b and Supplementary Table 2 for detailed statistics). (b) Haematopoietic cell infiltration and lipid accumulation in liver following HFD. Livers were processed as in Fig. 3c for H&E staining or F4/80 immunohistochemistry, or frozen and stained with Oil Red-O to visualize neutral lipids. Magnification is × 20. (c) Quantification of macrophage infiltration. F4/80-stained sections from b of 5 WT and 6 cKO livers were scanned and analysed using ImageJ Color Deconvolution 1.5 plugin as described in Methods section. The average number of F4/80-stained cells and the percentage of F4/80-stained area of the image in WT versus cKO were compared by the Mann–Whitney test. (d) Quantitative analysis of fat droplet sizes from b in WT and GRIP1 cKO HFD-fed mice (n=5 each). The area of fat droplets (ROI area) was determined using ImageJ (Methods section). KDEs of the lipid droplet size distributions (ncKO=40,110, nWT=9,985) were constructed and compared using sm (R) as described in Methods. Permutation test (N=10,000) was performed to test for the equality of cKO and WT KDE (P<0.0001); the 95% confidence interval for the equality of distributions is shown in grey. To demonstrate the differences in the frequency of larger droplets, the inset shows the Mann–Whitney comparison of droplet sizes with the area above 28 pixels. (e) The expression of inflammatory mediators, but not genes involved in glucose and fat metabolism, is deregulated by GRIP1 deletion in livers of HFD-fed mice. Gene expression was assessed by RT-qPCR with Hprt as a normalization control. n>5 per group; error bars are s.d. The statistical significance of differences was calculated using the Mann–Whitney test.
Figure 5
Figure 5. GRIP1 cKO HFD-fed mice develop glucose intolerance.
(a) Blood glucose levels in WT and cKO during ad libitum HFD feeding or after an overnight starvation. n>9 per group. The differences between fed and fasted mice within and between genotypes were evaluated by mixed linear modelling (Methods section and Supplementary Fig. 4c,d). The statistical significance of pairwise comparison of means was evaluated using Tukey's test with Holm's corrections for multiple comparisons (Methods section and Supplementary Tables 3–5). (b) GTT in HFD-fed WT (n=10) and cKO (n=11). Overnight-starved HFD-fed mice were injected with glucose (1.5 mg g−1 body weight, intraperitoneally (IP)) and blood glucose was measured at indicated times. GTT was analysed using mixed linear modelling (Methods section). Error bars are s.e.m. (c) The areas under the GTT curves (AUC) for individual animals were calculated using trapezoid methods in R and the Mann–Whitney test was used to determine significance. (d) Serum insulin levels were measured by ELISA in WT and cKO after 20 weeks of HFD. n>5 per group; error bars are s.d. The Mann–Whitney test was used to determine significance. (e) Insulin tolerance test (ITT) in HFD-fed WT and cKO mice. Mice were fasted for 4 h and injected with insulin (0.75 U kg−1 body weight, IP). Blood glucose levels were measured before (time 0) and at indicated times post-injection. n=13 and 15 for WT and cKO, respectively, except at 15 min when n=5 for each genotype; error bars are s.e.m. The Mann–Whitney test was used to determine significance. (f) HFD-fed GRIP1 cKO mice display insulin resistance in eWAT and muscle. WT and cKO mice were injected with PBS or insulin (0.75 U kg−1 body weight, IP), as indicated, killed 10 min later and WCE prepared from eWAT and muscle. The level of total and Thr308-phosphorylated Akt in WCE was assessed by immunoblotting. Blots for 2 mice per group were quantified using ImageJ. pAkt signals were normalized to those of total Akt; error bars are s.e.m. (g) Serum levels of FFA (n>5 each genotype), triglycerides (TG; n=12 each) and corticosterone (n=6 each) in HFD-fed WT and cKO were compared using Student's t-test. Error bars are s.e.m.
Figure 6
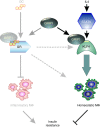
Figure 6. A model for GRIP1-dependent regulation of the balance between infiltrating and homeostatic macrophage populations.
GRIP1 is recruited as a GR ligand-dependent corepressor to attenuate the transcription of pro-inflammatory mediators in infiltrating macrophages (bar-headed line) and as a KLF4 coactivator to facilitate the resident macrophage transcription programme (green arrow). In addition, GR activates the transcription of KLF4 (dashed arrow) and may have an as yet unidentified direct mechanism for facilitating tissue macrophage programming (dashed arrow). The two macrophage populations have opposing roles in metabolic homeostasis and insulin resistance.

Similar articles

Cited by

References

    1. Johnson A. R., Milner J. J. & Makowski L. The inflammation highway: metabolism accelerates inflammatory traffic in obesity. Immunol. Rev. 249, 218–238 (2012). - PMC - PubMed
    1. Wensveen F. M., Valentic S., Sestan M., Turk Wensveen T. & Polic B. The ‘Big Bang' in obese fat: events initiating obesity-induced adipose tissue inflammation. Eur. J. Immunol. 45, 2446–2456 (2015). - PubMed
    1. Olefsky J. M. & Glass C. K. Macrophages, inflammation, and insulin resistance. Annu. Rev. Physiol. 72, 219–246 (2010). - PubMed
    1. Chawla A., Nguyen K. D. & Goh Y. P. Macrophage-mediated inflammation in metabolic disease. Nat. Rev. Immunol. 11, 738–749 (2011). - PMC - PubMed
    1. Xu L., Kitade H., Ni Y. & Ota T. Roles of chemokines and chemokine receptors in obesity-associated insulin resistance and nonalcoholic fatty liver disease. Biomolecules 5, 1563–1579 (2015). - PMC - PubMed

Publication types

MeSH terms