

Stool DNA Analysis is Cost-Effective for Colorectal Cancer Surveillance in Patients With Ulcerative Colitis
- PMID: 27464589
- PMCID: PMC5108686
- DOI: 10.1016/j.cgh.2016.07.018
Stool DNA Analysis is Cost-Effective for Colorectal Cancer Surveillance in Patients With Ulcerative Colitis
Erratum in
-
Correction.Clin Gastroenterol Hepatol. 2017 Apr;15(4):609. doi: 10.1016/j.cgh.2017.02.001. Epub 2017 Feb 10. Clin Gastroenterol Hepatol. 2017. PMID: 28193555 No abstract available.
Abstract
Background & aims: Patients with chronic ulcerative colitis are at increased risk for colorectal neoplasia (CRN). Surveillance by white-light endoscopy (WLE) or chromoendoscopy may reduce risk of CRN, but these strategies are underused. Analysis of DNA from stool samples (sDNA) can detect CRN with high levels of sensitivity, but it is not clear if this approach is cost-effective. We simulated these strategies for CRN detection to determine which approach is most cost-effective.
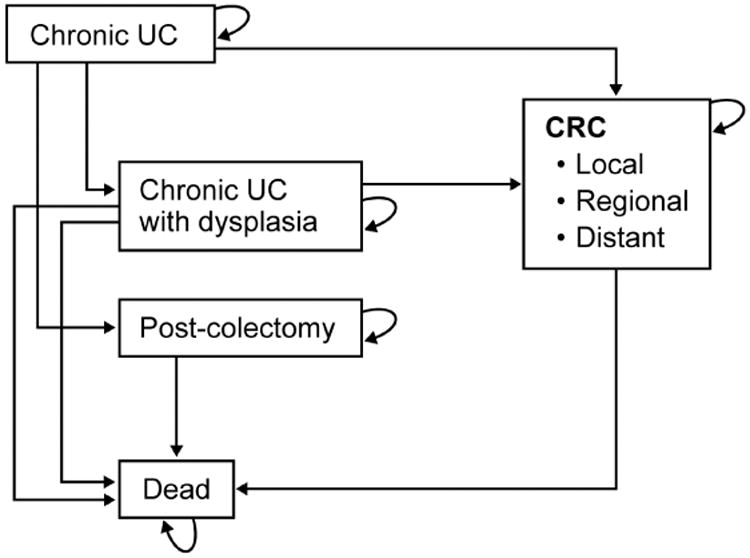
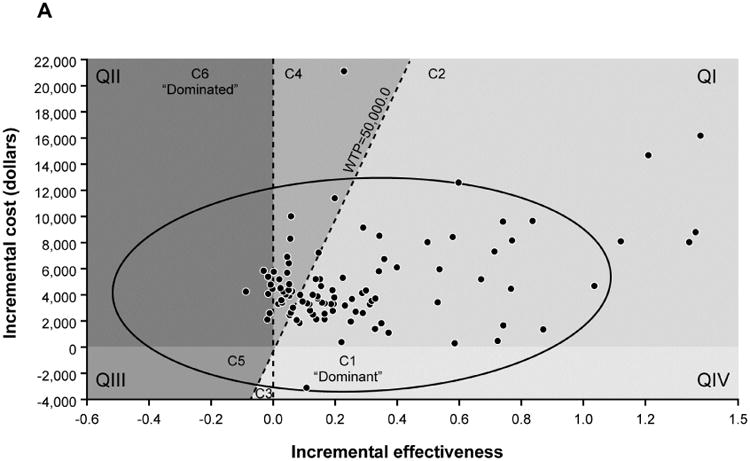
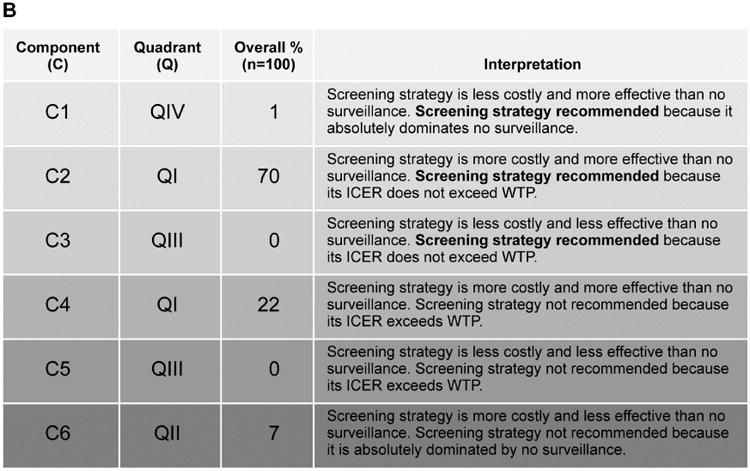
Methods: We adapted a previously published Markov model to simulate the clinical course of chronic ulcerative colitis, the incidence of cancer or dysplasia, and costs and benefits of care with 4 surveillance strategies: (1) analysis of sDNA and diagnostic chromoendoscopy for patients with positive results, (2) analysis of sDNA with diagnostic WLE for patients with positive results, (3) chromoendoscopy with targeted collection of biopsies, or (4) WLE with random collection of biopsies. Costs were based on 2014 Medicare reimbursement. The primary outcome was the incremental cost-effectiveness ratio (incremental cost/incremental difference in quality-adjusted life-years) compared with no surveillance and a willingness-to-pay threshold of $50,000.
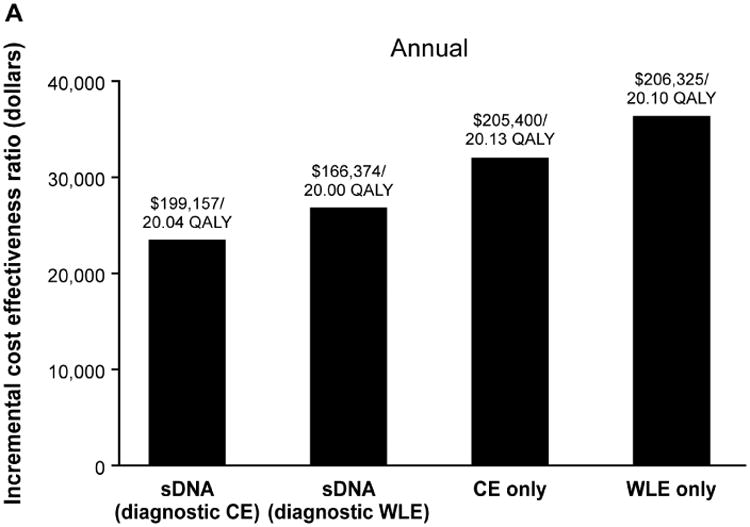
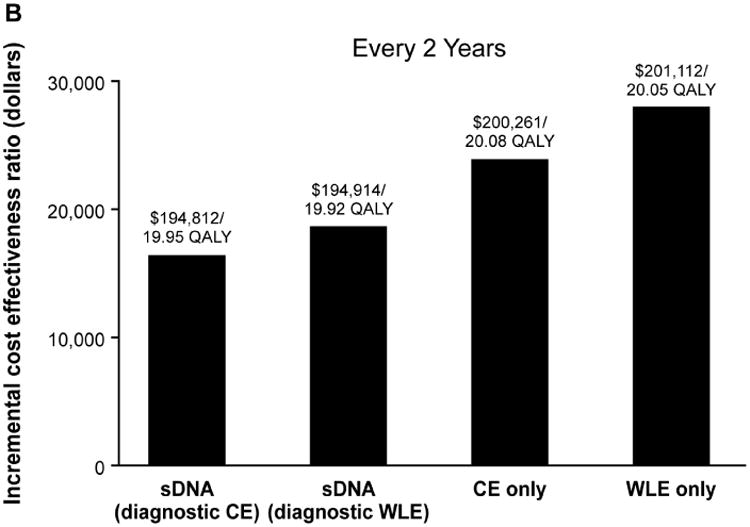
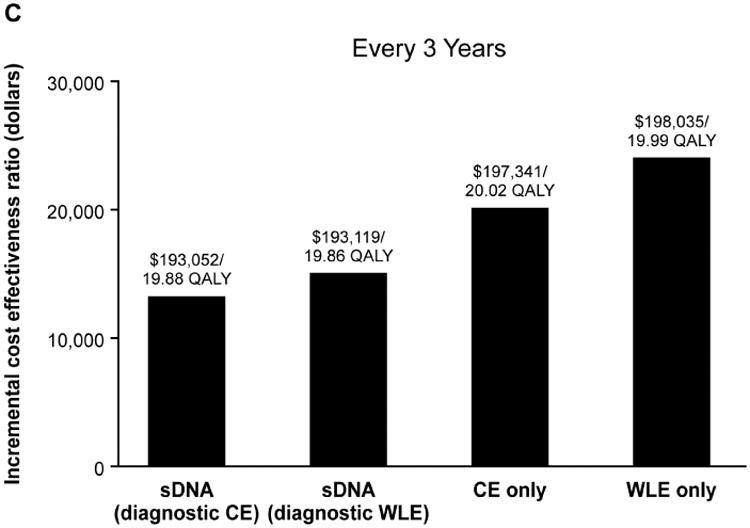
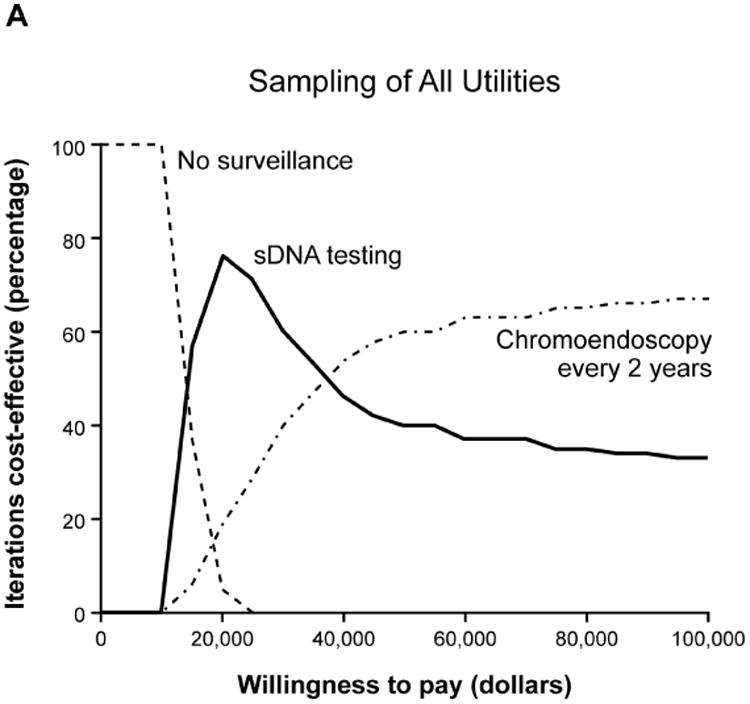
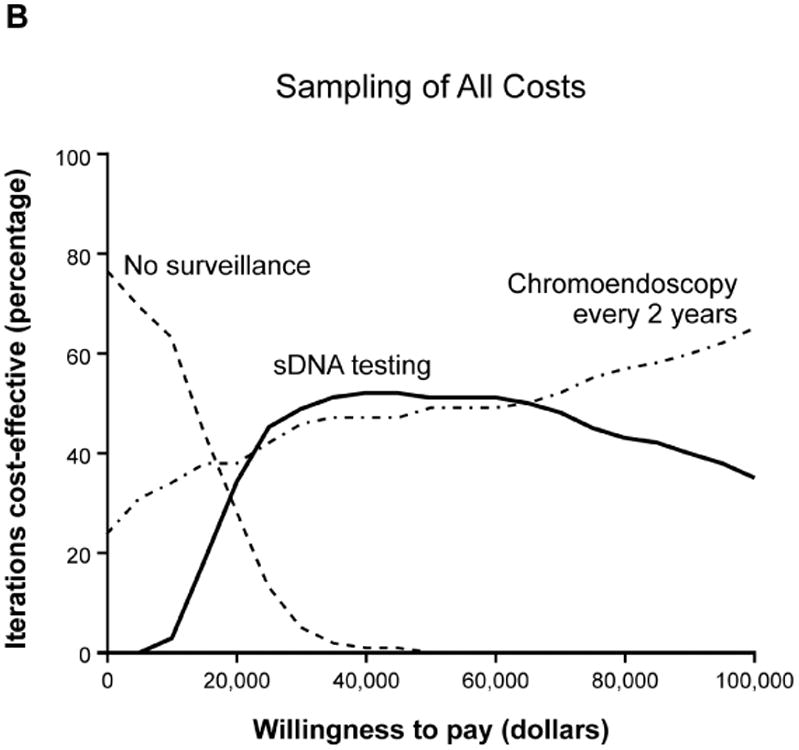
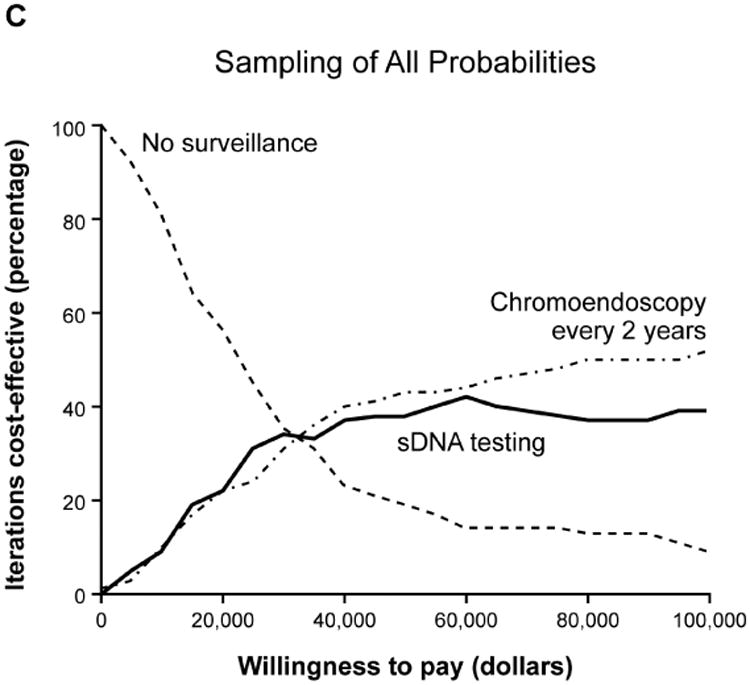
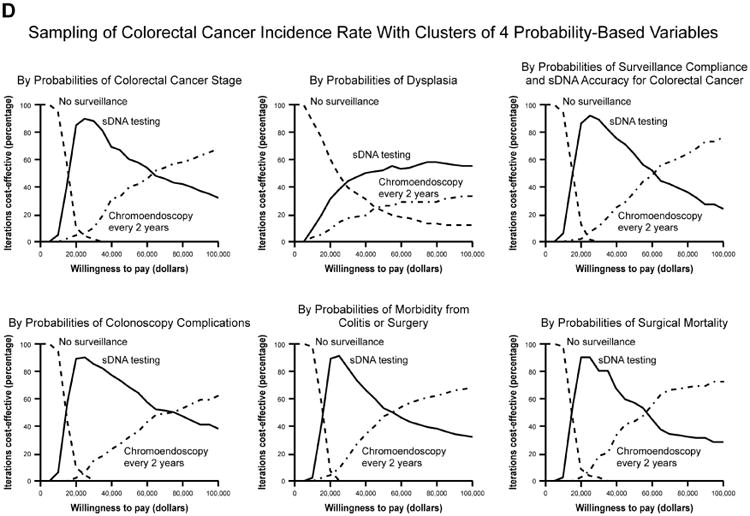
Results: All strategies fell below the willingness-to-pay threshold at 2-year intervals. Incremental cost-effectiveness ratios were $16,362 per quality-adjusted life-year for sDNA analysis with diagnostic chromoendoscopy; $18,643 per quality-adjusted life-year for sDNA analysis with diagnostic WLE; $23,830 per quality-adjusted life-year for chromoendoscopy alone; and $27,907 per quality-adjusted life-year for WLE alone. In sensitivity analyses, sDNA analysis with diagnostic chromoendoscopy was more cost-effective than chromoendoscopy alone, up to a cost of $1135 per sDNA test. sDNA analysis remained cost-effective at all rates of compliance; when combined with diagnostic chromoendoscopy, this approach was preferred over chromoendoscopy alone, when the specificity of the sDNA test for CRN was >65%.
Conclusions: Based on a Markov model, surveillance for CRN is cost-effective for patients with chronic ulcerative colitis. Analysis of sDNA with chromoendoscopies for patients with positive results was more cost-effective than chromoendoscopy or WLE alone.
Keywords: Cost Benefit Analysis; ICER; Inflammatory Bowel Diseases; QALY.
Copyright © 2016 AGA Institute. Published by Elsevier Inc. All rights reserved.
Figures
References
-
- Jess T, Rungoe C, Peyrin-Biroulet L. Risk of Colorectal Cancer in Patients With Ulcerative Colitis: A Meta-Analysis of Population-Based Cohort Studies. Clin Gastroenterol Hepatol. 2012 Jun;10(6):639–45. - PubMed
-
- Bernstein CN, Blanchard JF, Kliewer E, et al. Cancer risk in patients with inflammatory bowel disease: a population-based study. Cancer. 2001;91:854–62. - PubMed
-
- Collins PD, Mpofu C, Watson AJ, et al. Strategies for detecting colon cancer and/or dysplasia in patients with inflammatory bowel disease. Cochrane Database Syst Rev. 2006:CD000279. - PubMed
-
- Farraye FA, Odze RD, Eaden J, Itzkowitz SH. AGA technical review on the diagnosis and management of colorectal neoplasia in inflammatory bowel disease. Gastroenterology. 2010;138:746–74. 774. - PubMed
Publication types
MeSH terms
Substances
Grants and funding
LinkOut - more resources
Full Text Sources
Other Literature Sources
Medical
Miscellaneous
