

Food insecurity as a driver of obesity in humans: The insurance hypothesis
- PMID: 27464638
- PMCID: PMC5266557
- DOI: 10.1017/S0140525X16000947
Food insecurity as a driver of obesity in humans: The insurance hypothesis
Abstract
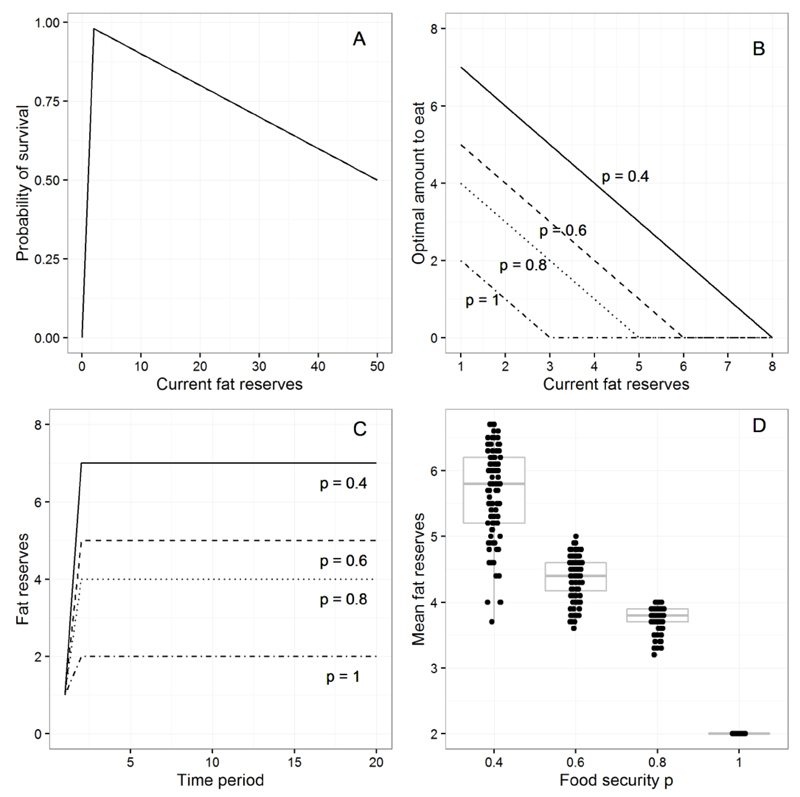
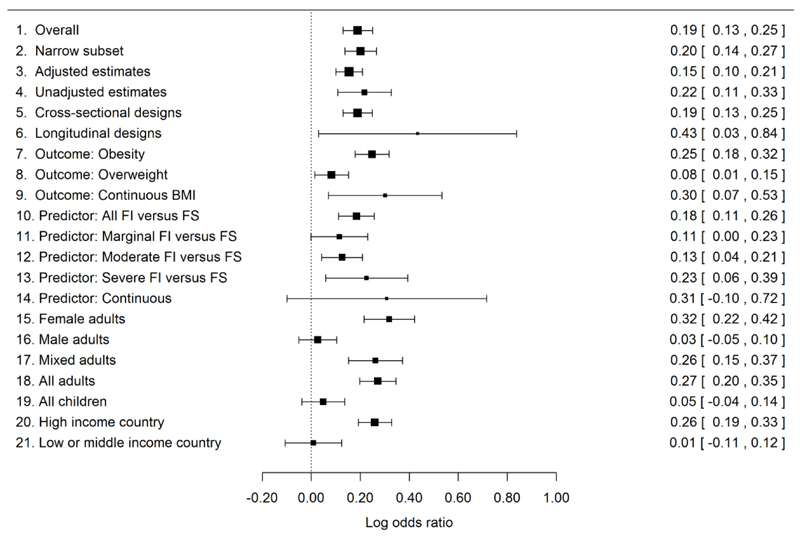
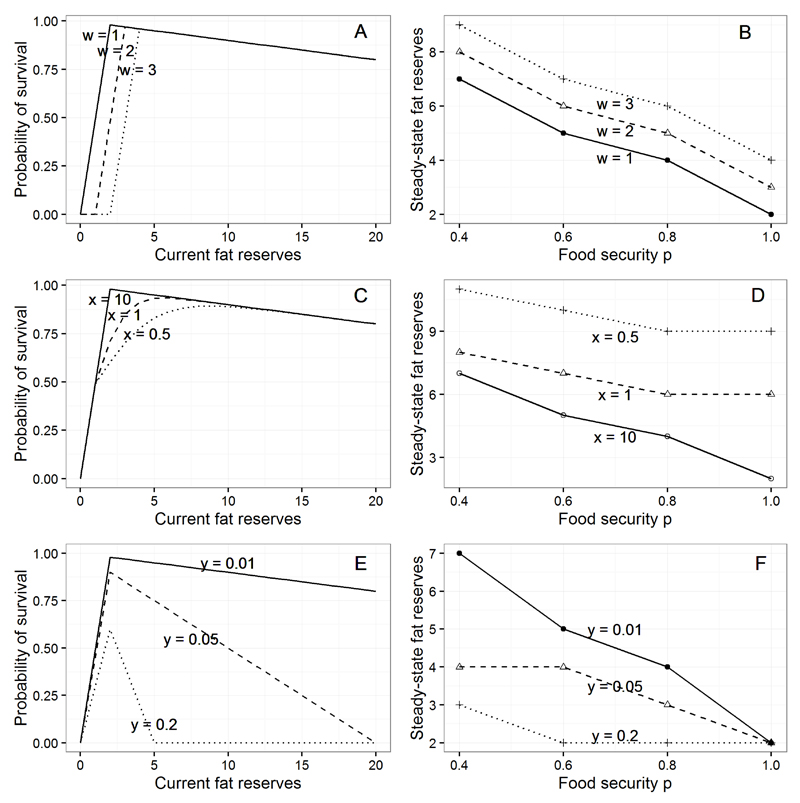
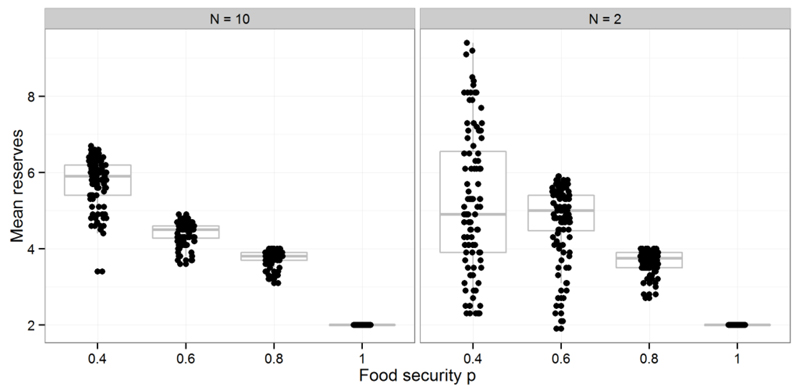
Integrative explanations of why obesity is more prevalent in some sectors of the human population than others are lacking. Here, we outline and evaluate one candidate explanation, the insurance hypothesis (IH). The IH is rooted in adaptive evolutionary thinking: The function of storing fat is to provide a buffer against shortfall in the food supply. Thus, individuals should store more fat when they receive cues that access to food is uncertain. Applied to humans, this implies that an important proximate driver of obesity should be food insecurity rather than food abundance per se. We integrate several distinct lines of theory and evidence that bear on this hypothesis. We present a theoretical model that shows it is optimal to store more fat when food access is uncertain, and we review the experimental literature from non-human animals showing that fat reserves increase when access to food is restricted. We provide a meta-analysis of 125 epidemiological studies of the association between perceived food insecurity and high body weight in humans. There is a robust positive association, but it is restricted to adult women in high-income countries. We explore why this could be in light of the IH and our theoretical model. We conclude that although the IH alone cannot explain the distribution of obesity in the human population, it may represent a very important component of a pluralistic explanation. We also discuss insights it may offer into the developmental origins of obesity, dieting-induced weight gain, and anorexia nervosa.
Keywords: Obesity; behavioural ecology; eating disorders; food insecurity; hunger-obesity paradox; meta-analysis; overweight; weight regulation.
Figures
Comment in
-
Future Research Directions for the Insurance Hypothesis regarding Food Insecurity and Obesity.Behav Brain Sci. 2017 Jan;40:e110. doi: 10.1017/S0140525X16001357. Epub 2017 May 11. Behav Brain Sci. 2017. PMID: 28983139 Free PMC article.
-
Mapping multiple drivers of human obesity.Behav Brain Sci. 2017 Jan;40:e107. doi: 10.1017/S0140525X16001321. Behav Brain Sci. 2017. PMID: 29342568
-
Eating and body image: Does food insecurity make us feel thinner?Behav Brain Sci. 2017 Jan;40:e106. doi: 10.1017/S0140525X1600131X. Behav Brain Sci. 2017. PMID: 29342569
-
Expanding the insurance hypothesis of obesity with physiological cues.Behav Brain Sci. 2017 Jan;40:e108. doi: 10.1017/S0140525X16001333. Behav Brain Sci. 2017. PMID: 29342570
-
Epidemiological foundations for the insurance hypothesis: Methodological considerations.Behav Brain Sci. 2017 Jan;40:e109. doi: 10.1017/S0140525X16001345. Behav Brain Sci. 2017. PMID: 29342571
-
The life history model of the insurance hypothesis.Behav Brain Sci. 2017 Jan;40:e111. doi: 10.1017/S0140525X16001369. Behav Brain Sci. 2017. PMID: 29342572
-
Episodic memory as an explanation for the insurance hypothesis in obesity.Behav Brain Sci. 2017 Jan;40:e113. doi: 10.1017/S0140525X16001382. Behav Brain Sci. 2017. PMID: 29342573
-
Toward a mechanistic understanding of the impact of food insecurity on obesity.Behav Brain Sci. 2017 Jan;40:e116. doi: 10.1017/S0140525X16001412. Behav Brain Sci. 2017. PMID: 29342574
-
Appraising food insecurity.Behav Brain Sci. 2017 Jan;40:e112. doi: 10.1017/S0140525X16001370. Behav Brain Sci. 2017. PMID: 29342575
-
Implicit attitudes, eating behavior, and the development of obesity.Behav Brain Sci. 2017 Jan;40:e114. doi: 10.1017/S0140525X16001394. Behav Brain Sci. 2017. PMID: 29342576 Free PMC article.
-
A life-history theory perspective on obesity.Behav Brain Sci. 2017 Jan;40:e115. doi: 10.1017/S0140525X16001400. Behav Brain Sci. 2017. PMID: 29342577
-
Potential psychological accounts for the relation between food insecurity and body overweight.Behav Brain Sci. 2017 Jan;40:e117. doi: 10.1017/S0140525X16001424. Behav Brain Sci. 2017. PMID: 29342578
-
Predicting human adiposity - sometimes - with food insecurity: Broaden the model for better accuracy.Behav Brain Sci. 2017 Jan;40:e119. doi: 10.1017/S0140525X16001448. Behav Brain Sci. 2017. PMID: 29342579
-
Social nature of eating could explain missing link between food insecurity and childhood obesity.Behav Brain Sci. 2017 Jan;40:e122. doi: 10.1017/S0140525X16001473. Behav Brain Sci. 2017. PMID: 29342580
-
A game theory appraisal of the insurance hypothesis: Specific polymorphisms in the energy homeostasis network as imprints of a successful minimax strategy.Behav Brain Sci. 2017 Jan;40:e123. doi: 10.1017/S0140525X16001485. Behav Brain Sci. 2017. PMID: 29342581
-
Towards a behavioural ecology of obesity.Behav Brain Sci. 2017 Jan;40:e118. doi: 10.1017/S0140525X16001436. Behav Brain Sci. 2017. PMID: 29342582
-
Anti-fat discrimination in marriage more clearly explains the poverty-obesity paradox.Behav Brain Sci. 2017 Jan;40:e120. doi: 10.1017/S0140525X1600145X. Behav Brain Sci. 2017. PMID: 29342583
-
Committed to the insurance hypothesis of obesity.Behav Brain Sci. 2017 Jan;40:e121. doi: 10.1017/S0140525X16001461. Behav Brain Sci. 2017. PMID: 29342584
-
Anorexia: A perverse effect of attempting to control the starvation response.Behav Brain Sci. 2017 Jan;40:e125. doi: 10.1017/S0140525X16001503. Behav Brain Sci. 2017. PMID: 29342586
-
Using food insecurity in health prevention to promote consumer's embodied self-regulation.Behav Brain Sci. 2017 Jan;40:e126. doi: 10.1017/S0140525X16001515. Behav Brain Sci. 2017. PMID: 29342589
-
Household-level financial uncertainty could be the primary driver of the global obesity epidemic.Behav Brain Sci. 2017 Jan;40:e128. doi: 10.1017/S0140525X16001539. Behav Brain Sci. 2017. PMID: 29342590
-
Children respond to food restriction by increasing food consumption.Behav Brain Sci. 2017 Jan;40:e129. doi: 10.1017/S0140525X16001540. Behav Brain Sci. 2017. PMID: 29342591
References
-
- Anderson JL, Crawford CB, Nadeau J, Lindberg T. Was the Duchess of windsor right? A cross-cultural review of the socioecology of ideals of female body shape. Ethology and Sociobiology. 1992;13(3):197–227. doi: 10.1016/0162-3095(92)90033-Z. - DOI
-
- Basiotis P, Lino M. Food insufficiency and prevalence of overweight among adult women. Family Economics and Nutrition. 2003;15:55–57.
-
- Bednekoff PA, Houston AI. Optimising fat reserves over winter - a dynamic model. Oikos. 1994;71:408–415.
Publication types
MeSH terms
Grants and funding
LinkOut - more resources
Full Text Sources
Other Literature Sources
Medical
