

Codon Optimization to Enhance Expression Yields Insights into Chloroplast Translation
- PMID: 27465114
- PMCID: PMC5074611
- DOI: 10.1104/pp.16.00981
Codon Optimization to Enhance Expression Yields Insights into Chloroplast Translation
Abstract
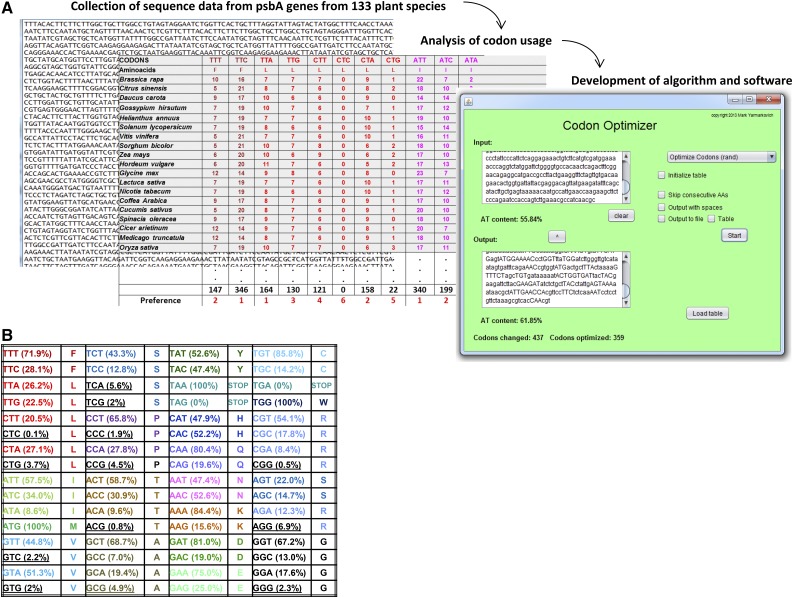
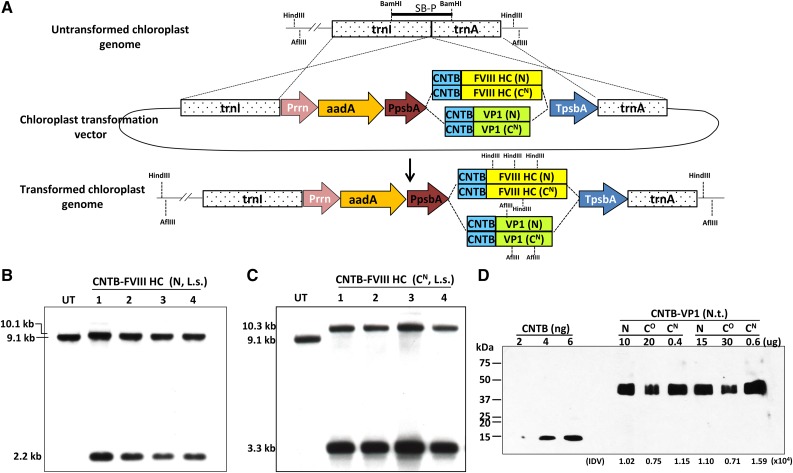
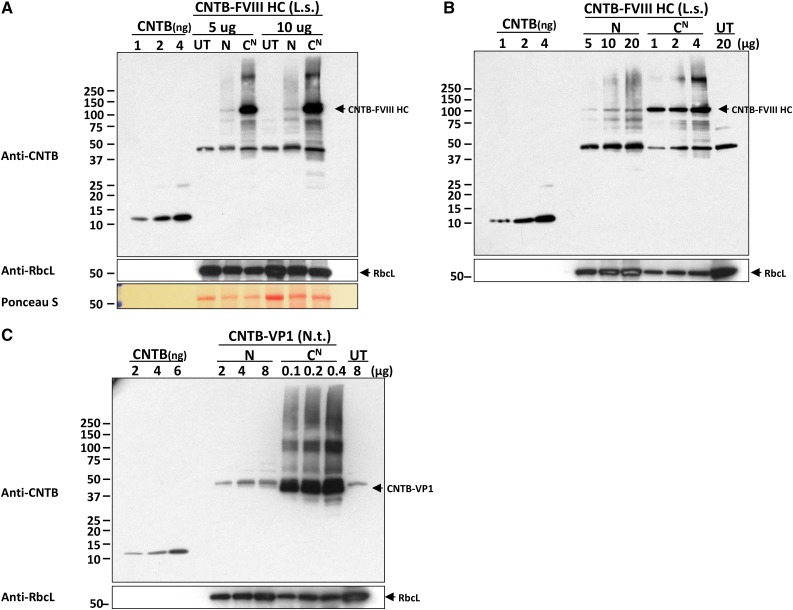
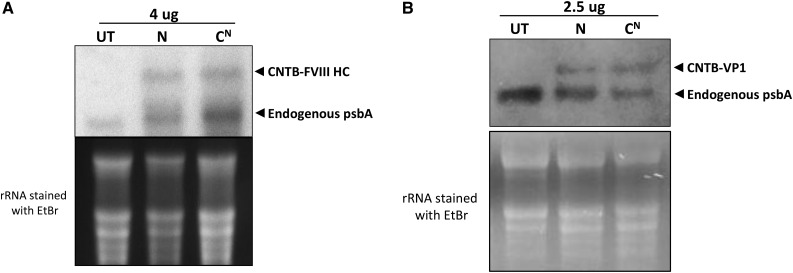
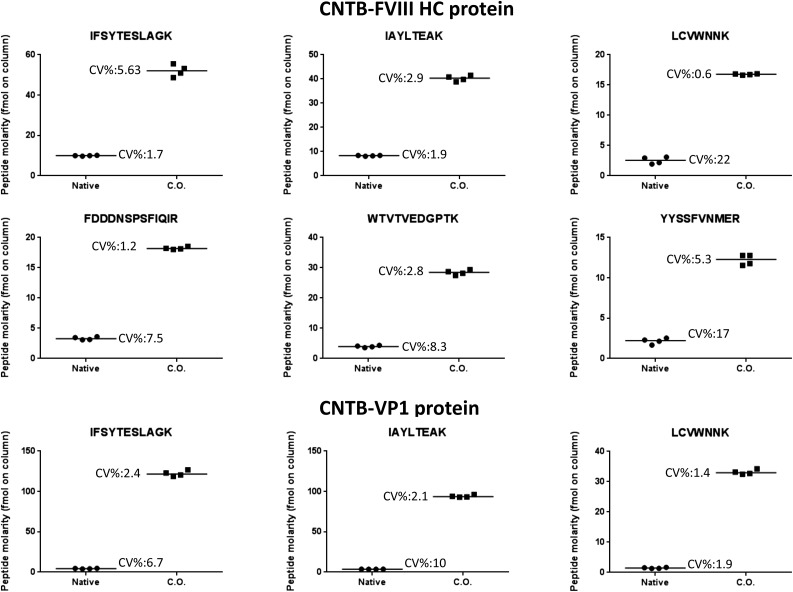
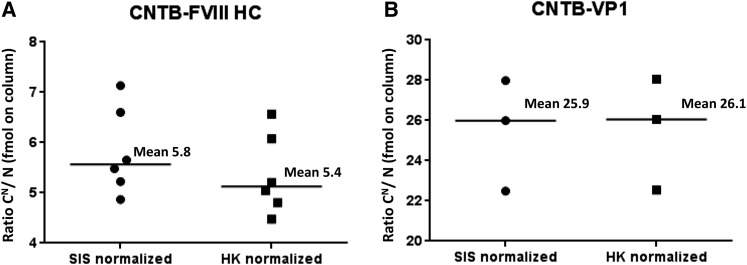
Codon optimization based on psbA genes from 133 plant species eliminated 105 (human clotting factor VIII heavy chain [FVIII HC]) and 59 (polio VIRAL CAPSID PROTEIN1 [VP1]) rare codons; replacement with only the most highly preferred codons decreased transgene expression (77- to 111-fold) when compared with the codon usage hierarchy of the psbA genes. Targeted proteomic quantification by parallel reaction monitoring analysis showed 4.9- to 7.1-fold or 22.5- to 28.1-fold increase in FVIII or VP1 codon-optimized genes when normalized with stable isotope-labeled standard peptides (or housekeeping protein peptides), but quantitation using western blots showed 6.3- to 8-fold or 91- to 125-fold increase of transgene expression from the same batch of materials, due to limitations in quantitative protein transfer, denaturation, solubility, or stability. Parallel reaction monitoring, to our knowledge validated here for the first time for in planta quantitation of biopharmaceuticals, is especially useful for insoluble or multimeric proteins required for oral drug delivery. Northern blots confirmed that the increase of codon-optimized protein synthesis is at the translational level rather than any impact on transcript abundance. Ribosome footprints did not increase proportionately with VP1 translation or even decreased after FVIII codon optimization but is useful in diagnosing additional rate-limiting steps. A major ribosome pause at CTC leucine codons in the native gene of FVIII HC was eliminated upon codon optimization. Ribosome stalls observed at clusters of serine codons in the codon-optimized VP1 gene provide an opportunity for further optimization. In addition to increasing our understanding of chloroplast translation, these new tools should help to advance this concept toward human clinical studies.
© 2016 American Society of Plant Biologists. All rights reserved.
Figures
Similar articles
-
Multilevel effects of light on ribosome dynamics in chloroplasts program genome-wide and psbA-specific changes in translation.PLoS Genet. 2018 Aug 6;14(8):e1007555. doi: 10.1371/journal.pgen.1007555. eCollection 2018 Aug. PLoS Genet. 2018. PMID: 30080854 Free PMC article.
-
Optimization of codon composition and regulatory elements for expression of human insulin like growth factor-1 in transgenic chloroplasts and evaluation of structural identity and function.BMC Biotechnol. 2009 Apr 3;9:33. doi: 10.1186/1472-6750-9-33. BMC Biotechnol. 2009. PMID: 19344517 Free PMC article.
-
Cold chain and virus-free oral polio booster vaccine made in lettuce chloroplasts confers protection against all three poliovirus serotypes.Plant Biotechnol J. 2019 Jul;17(7):1357-1368. doi: 10.1111/pbi.13060. Epub 2019 Jan 11. Plant Biotechnol J. 2019. PMID: 30575284 Free PMC article.
-
Mechanisms governing codon usage bias and the implications for protein expression in the chloroplast of Chlamydomonas reinhardtii.Plant J. 2022 Nov;112(4):919-945. doi: 10.1111/tpj.15970. Epub 2022 Oct 19. Plant J. 2022. PMID: 36071273 Free PMC article. Review.
-
Codon optimality, bias and usage in translation and mRNA decay.Nat Rev Mol Cell Biol. 2018 Jan;19(1):20-30. doi: 10.1038/nrm.2017.91. Epub 2017 Oct 11. Nat Rev Mol Cell Biol. 2018. PMID: 29018283 Free PMC article. Review.
Cited by
-
Artificial intelligence-driven systems engineering for next-generation plant-derived biopharmaceuticals.Front Plant Sci. 2023 Nov 15;14:1252166. doi: 10.3389/fpls.2023.1252166. eCollection 2023. Front Plant Sci. 2023. PMID: 38034587 Free PMC article. Review.
-
Codon Bias of the DDR1 Gene and Transcription Factor EHF in Multiple Species.Int J Mol Sci. 2024 Oct 4;25(19):10696. doi: 10.3390/ijms251910696. Int J Mol Sci. 2024. PMID: 39409024 Free PMC article.
-
Evaluation of biotransformation capacity of transplastomic plants and hairy roots of Nicotiana tabacum expressing human cytochrome P450 2D6.Transgenic Res. 2022 Jun;31(3):351-368. doi: 10.1007/s11248-022-00305-x. Epub 2022 Apr 13. Transgenic Res. 2022. PMID: 35416604 Free PMC article.
-
Plant cell-made protein antigens for induction of Oral tolerance.Biotechnol Adv. 2019 Nov 15;37(7):107413. doi: 10.1016/j.biotechadv.2019.06.012. Epub 2019 Jun 26. Biotechnol Adv. 2019. PMID: 31251968 Free PMC article. Review.
-
Oral Tolerance Induction in Hemophilia B Dogs Fed with Transplastomic Lettuce.Mol Ther. 2017 Feb 1;25(2):512-522. doi: 10.1016/j.ymthe.2016.11.009. Mol Ther. 2017. PMID: 28153098 Free PMC article.
References
-
- Birch-Machin I, Newell CA, Hibberd JM, Gray JC (2004) Accumulation of rotavirus VP6 protein in chloroplasts of transplastomic tobacco is limited by protein stability. Plant Biotechnol J 2: 261–270 - PubMed
Publication types
MeSH terms
Substances
Grants and funding
LinkOut - more resources
Full Text Sources
Other Literature Sources
