

Trends in type 2 diabetes incidence and mortality in Scotland between 2004 and 2013
- PMID: 27465219
- PMCID: PMC5016553
- DOI: 10.1007/s00125-016-4054-9
Trends in type 2 diabetes incidence and mortality in Scotland between 2004 and 2013
Erratum in
-
Erratum to: Trends in type 2 diabetes incidence and mortality in Scotland between 2004 and 2013.Diabetologia. 2016 Nov;59(11):2492. doi: 10.1007/s00125-016-4089-y. Diabetologia. 2016. PMID: 27597171 Free PMC article. No abstract available.
Abstract
Aims/hypothesis: The relative contribution of increasing incidence and declining mortality to increasing prevalence of type 2 diabetes in Scotland is unclear. Trends in incidence and mortality rates are described for type 2 diabetes in Scotland between 2004 and 2013 by age, sex and socioeconomic deprivation.
Methods: Data for incident and prevalent cases of type 2 diabetes were obtained from the Scottish national diabetes register with number of deaths identified from linkage to mortality records. Population size and death data for Scotland by age, sex and socioeconomic deprivation were obtained from National Records of Scotland. Age- and sex-specific incidence and mortality rates stratified by year and deciles of socioeconomic status were calculated using Poisson models.
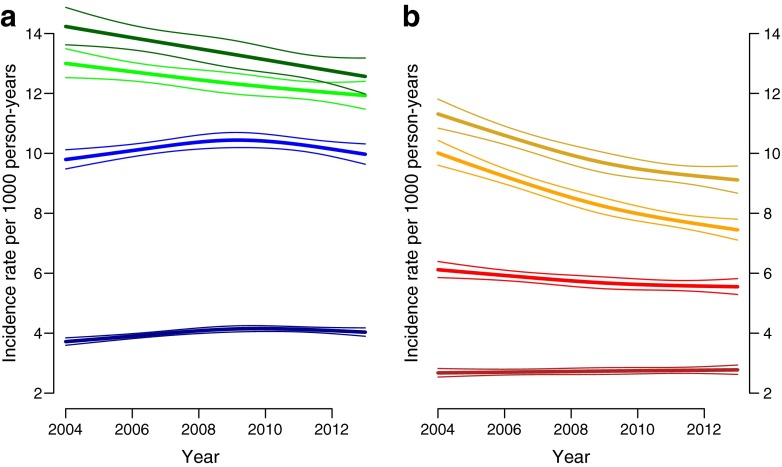
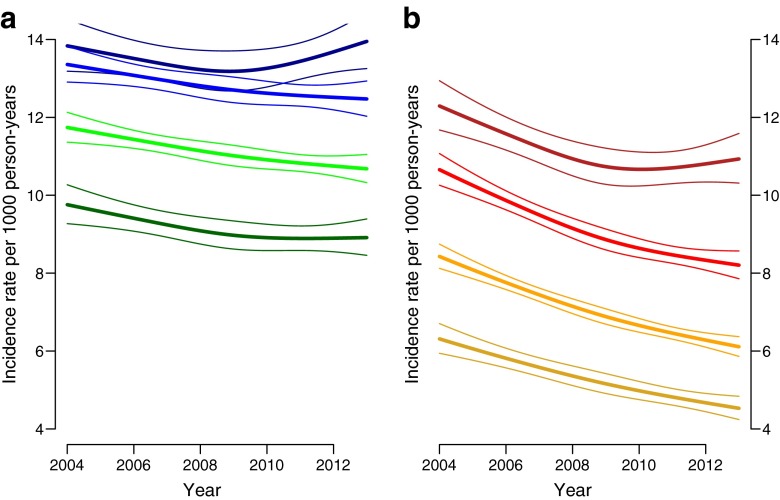
Results: There were 180,290 incident cases of type 2 diabetes in Scotland between 2004 and 2013. Overall, incidence of type 2 diabetes remained stable over time and was 4.88 (95% CI 4.84, 4.90) and 3.33 (3.28, 3.32) per 1000 in men and women, respectively. However, incidence increased among young men, remained stable in young women, and declined in older men and women. Incidence rates declined in all socioeconomic groups but increased after 2008 in the most deprived groups. Standardised mortality ratios associated with diabetes, adjusted for age and socioeconomic group, were 1.38 (1.36, 1.41) in men and 1.49 (1.45, 1.52) in women, and remained constant over time.
Conclusions/interpretation: Incidence of type 2 diabetes has stabilised in recent years suggesting that increasing prevalence may be primarily attributed to declining mortality. Prevention of type 2 diabetes remains important, particularly among socioeconomically deprived populations.
Keywords: Epidemiology; Prediction and prevention of type 2 diabetes; Socioeconomic aspects.
Conflict of interest statement
Funding SHR is supported by a Chief Scientist Office post-doctoral fellowship. Funding for diabetes register linkage was provided by the Scottish Government. The Scottish Diabetes Research Network receives financial support from NHS Research Scotland. Duality of interest SHW received an honorarium from Global MedEd/Astra Zeneca in September 2014 for contributing a lecture to a series of educational videos aimed at primary care professionals and specialists in the Middle East. RMcC has received personal fees from NovoNordisk and Sanofi Aventis for being on advisory boards outside of this submitted work. HC has received grants and personal fees from Sanofi and Regeneron Pharmaceuticals, Eli Lilly & Company, Roche Pharmaceuticals, Boehringer Ingelheim and Astra Zeneca outside of this submitted work. DMcA received personal fees from Roche for delivering a tutorial to health professionals. All other authors declare that there is no duality of interest associated with their contribution to this manuscript. Contribution statement The study was conceived by SHW and SHR; data preparation and statistical analyses were carried out by JJK. JJK and SHR wrote the first draft of the paper. All authors contributed to the interpretation of the findings and the paper’s critical revision. All authors have approved the final version of the manuscript. SHR is responsible for the integrity of the work as a whole.
Figures
References
-
- International Diabetes Federation . International Diabetes Federation diabetes atlas. 7. Brussels: International Diabetes Federation; 2015.
-
- Scottish Diabetes Survey Monitoring Group (2014) Scottish diabetes survey 2014. NHS Scotland
Publication types
MeSH terms
Grants and funding
LinkOut - more resources
Full Text Sources
Other Literature Sources
Medical
