. 2016 Jul 28:6:30769.
doi: 10.1038/srep30769.

Sensory hypo-excitability in a rat model of fetal development in Fragile X Syndrome

Affiliations

Sensory hypo-excitability in a rat model of fetal development in Fragile X Syndrome

Julia Berzhanskaya et al. Sci Rep. .

Erratum in

Abstract

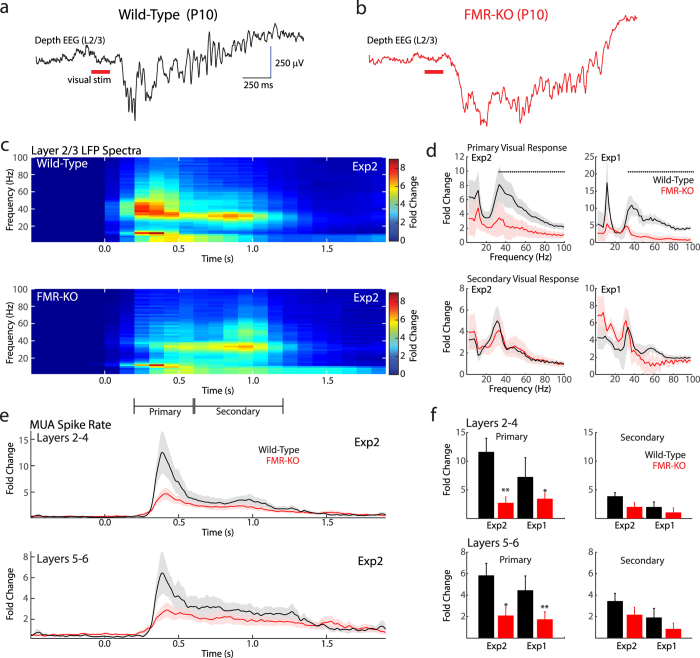
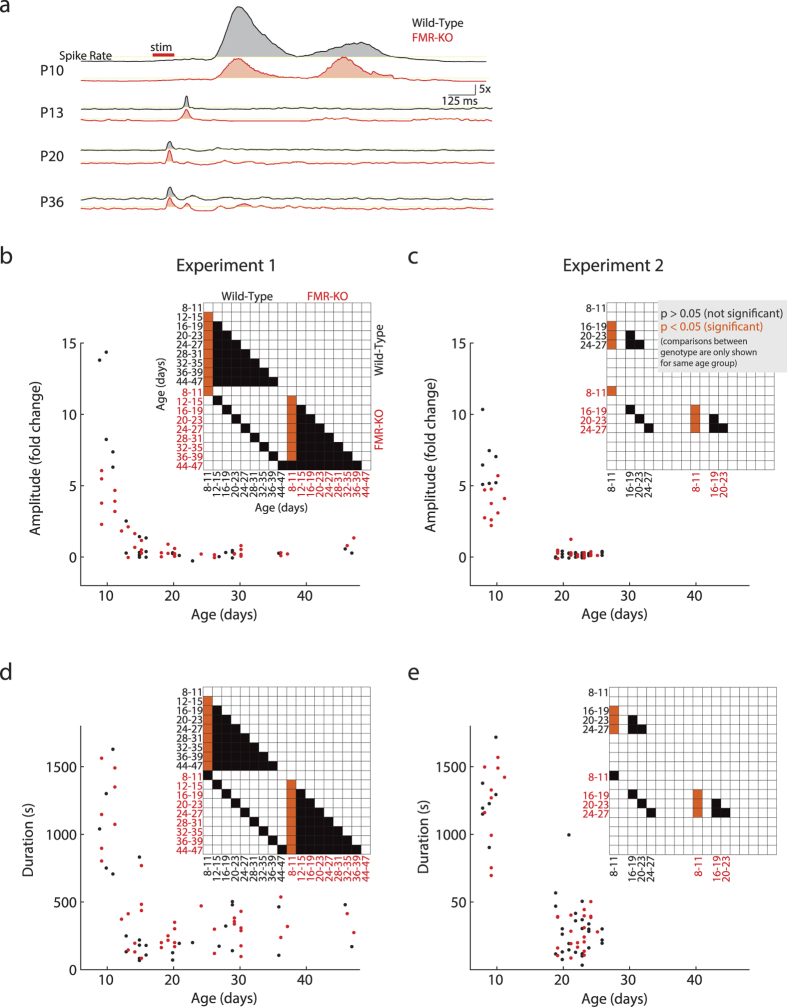
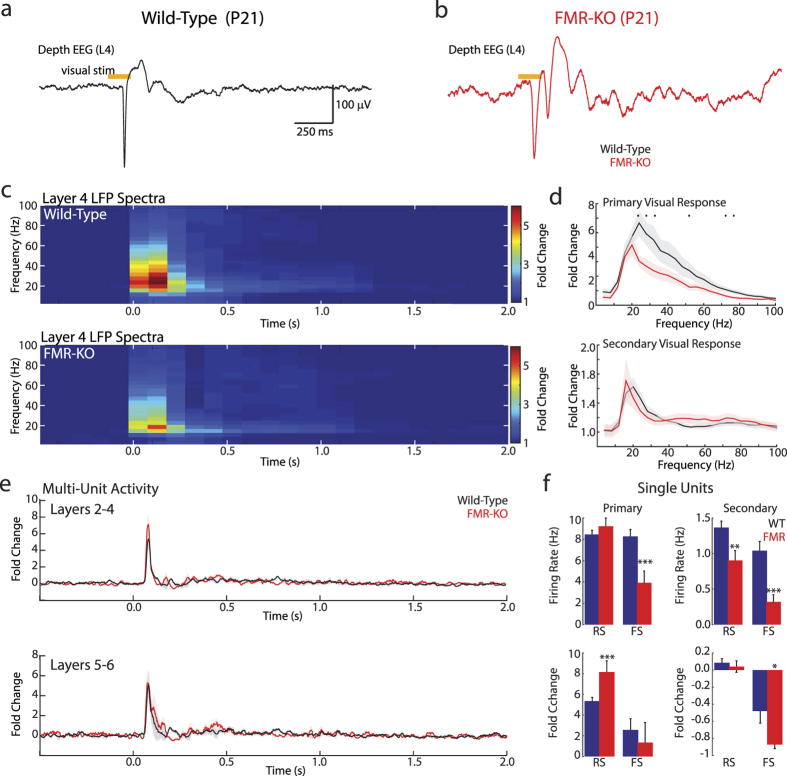
Fragile X syndrome (FXS) is characterized by sensory hyper-sensitivity, and animal models suggest that neuronal hyper-excitability contributes to this phenotype. To understand how sensory dysfunction develops in FXS, we used the rat model (FMR-KO) to quantify the maturation of cortical visual responses from the onset of responsiveness prior to eye-opening, through age equivalents of human juveniles. Rather than hyper-excitability, visual responses before eye-opening had reduced spike rates and an absence of early gamma oscillations, a marker for normal thalamic function at this age. Despite early hypo-excitability, the developmental trajectory of visual responses in FMR-KO rats was normal, and showed the expected loss of visually evoked bursting at the same age as wild-type, two days before eye-opening. At later ages, during the third and fourth post-natal weeks, signs of mild hyper-excitability emerged. These included an increase in the visually-evoked firing of regular spiking, presumptive excitatory, neurons, and a reduced firing of fast-spiking, presumptive inhibitory, neurons. Our results show that early network changes in the FMR-KO rat arise at ages equivalent to fetal humans and have consequences for excitability that are opposite those found in adults. This suggests identification and treatment should begin early, and be tailored in an age-appropriate manner.


Figures

Figure 1
Figure 1. Infant FMR-KO rats lack early gamma oscillations.
(a) Representative depth EEG (L2/3) response to visual stimulus in a P10 wild-type animal. (b) Representative trace for a P10 FMR-KO. (c) Population mean (P9–11) peri-stimulus spectrogram of fold increase in dEEG power over baseline (1 s prior to stim) following visual stimulation of wild-type rats (above) and littermate FMR-KO rats (below) for the blinded, confirmatory experiment (Exp2). X-axis is time relative to stimulus onset. Visual responses consist of an initial, ‘primary’, response with nested early gamma oscillations and a ‘secondary’ response with embedded spindle burst (20–30 Hz oscillation). (d) Population mean of the peak increase at each frequency for the primary visual response (above) and secondary response (below). Results for Exp2 are in the left column, and for the not-blind exploratory Exp1 on the right. Dots show frequencies with significant difference between groups. (e) Population mean peri-stimulus time histogram for visually evoked multi-unit activity in superficial layers (L2–4, above) and deep layers (L5–6, below) for Exp2. Y-axis shows fold increase in firing rate relative to baseline. (f) Population mean multi-unit spike rate fold-increases for both experiments during primary (left) and secondary (right) visual responses in superficial (top) and deep (bottom) layers. *p < 0.05; **p < 0.01 by Wilcoxon rank sum. Bars and shading are SEM for all panels.
Figure 2
Figure 2. Developmental sharpening of visual responses is not delayed in FMR-KO rats.
(a) Representative post-stimulus time histograms show fold-increase in multi-unit activity for littermates (Exp2). Note large drop in amplitude (but sharper tuning) of evoked response in both groups between P10 and P12. (b) Development of visual response amplitudes for Exp1. Integrated fold-change in multi-unit spike-rates (all layers) is graphed by age of animal. Matrix of pair-wise significance differences (Tukey post-hoc) for amplitude four-day means is shown as inset. Comparisons between different ages within genotype are shown to demonstrate that the developmental shift between P11 and P12 occurs in both groups. Comparisons between genotypes for the same ages (eg. P8–9 WT vs P8–9 KO) are shown to demonstrate that amplitude is affected by FMR-KO specifically during the early developmental period (P8–11). Comparisons between WT and KO at different ages are not shown. Orange = p < 0.05; black = p > 0.05; white = comparison not shown for clarity. (c) Development of amplitudes for Exp2. (d) Development of visual response duration for Exp1. Note that duration P8–11 is not different between genotypes. (e) Development of duration for Exp2.
Figure 3
Figure 3. Juvenile FMR-KO rats have hyper-excitable visual responses.
(a) Representative dEEG (L4) response to 100 ms light flash of a wild-type animal. (b) Representative response of FMR-KO rat. (c) Population mean (P19–24) time-spectrogram of fold-increase over baseline (1 s pre-stimulus) for L4 dEEG for wild-type (above) and FMR-KO (below). All juvenile analysis from Exp2. Time axis is aligned to onset of visual stimulus. Visual responses are divided into primary (0–250 ms) and secondary (300–1200 ms) responses. (d) Population mean of spectral fold-increase over baseline for primary (top) and secondary (bottom) L4 dEEG. Spectral bins with significant difference (p < 0.05) between wild-type and FMR-KO are shown by black dots. (e) Population mean multi-unit peri-stimulus time histogram of fold increase over baseline in firing rates for superficial (L2–4, top) and deep (L5–6, bottom) neurons. (f) Visual response characteristics of single-units. Firing rate change measured by absolute firing-rate (top) during primary response (left) and secondary response (right), and by fold-increase over baseline (2 s pre-stimulus; bottom) for the same periods. Regular spiking (RS; excitatory) and fast-spiking (FS; inhibitory) neurons are graphed separately. ***p < 0.001, *p < 0.05 by t-test.

References

    1. Darnell J. C. et al. FMRP stalls ribosomal translocation on mRNAs linked to synaptic function and autism. Cell 146, 247–261 (2011). - PMC - PubMed
    1. Abitbol M. et al. Nucleus basalis magnocellularis and hippocampus are the major sites of FMR-1 expression in the human fetal brain. Nat. Genet. 4, 147–153 (1993). - PubMed
    1. Ludwig A. L. et al. CNS expression of murine fragile X protein (FMRP) as a function of CGG-repeat size. Hum. Mol. Genet. 23, 3228–3238 (2014). - PMC - PubMed
    1. Wijetunge L. S., Chattarji S., Wyllie D. J. & Kind P. C. Fragile X syndrome: from targets to treatments. Neuropharmacology 68, 83–96 (2013). - PubMed
    1. Iossifov I. et al. The contribution of de novo coding mutations to autism spectrum disorder. Nature 515, 216–221 (2014). - PMC - PubMed

Publication types

Substances