Comparative Study
. 2016 Jul 28:7:12306.
doi: 10.1038/ncomms12306.

Local biodiversity is higher inside than outside terrestrial protected areas worldwide

Affiliations
Comparative Study

Local biodiversity is higher inside than outside terrestrial protected areas worldwide

Claudia L Gray et al. Nat Commun. .

Abstract

Protected areas are widely considered essential for biodiversity conservation. However, few global studies have demonstrated that protection benefits a broad range of species. Here, using a new global biodiversity database with unprecedented geographic and taxonomic coverage, we compare four biodiversity measures at sites sampled in multiple land uses inside and outside protected areas. Globally, species richness is 10.6% higher and abundance 14.5% higher in samples taken inside protected areas compared with samples taken outside, but neither rarefaction-based richness nor endemicity differ significantly. Importantly, we show that the positive effects of protection are mostly attributable to differences in land use between protected and unprotected sites. Nonetheless, even within some human-dominated land uses, species richness and abundance are higher in protected sites. Our results reinforce the global importance of protected areas but suggest that protection does not consistently benefit species with small ranges or increase the variety of ecological niches.


Figures
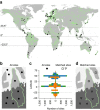
Figure 1
Figure 1. Spatial and taxonomic structure of data.
(a) Location of 4,592 sites outside and 1,939 inside 359 protected areas (pale green; all terrestrial protected areas from ref. 34) from 156 studies in the full (all sites) dataset; horizontal lines indicate equator and tropics of Cancer and Capricorn; world map from ref. . (b) Diagram of a single study, showing sampling sites inside and outside a protected area (green outline) and different land uses (shades of grey). (c) Latitudinal and taxonomic distribution of sites by 6° latitudinal bands for all sites (left) and subset of sites matched by land use (right); colours correspond to taxonomic groups (green=plants, blue=invertebrates, orange=vertebrates). (d) Diagram of the same study as (b) showing subsets of sites matched by land use (matched-sites data; this included 144 studies with 3,296 sites outside and 1,719 inside 313 protected areas). Sampled protected areas have similar distribution to all terrestrial protected areas in terms of size, year of establishment and IUCN Protected Areas Management Category (henceforth IUCN category) and broadly similar proportion of total area in each of the land uses, ecoregions and biomes represented (Supplementary Fig. 1).
Figure 2
Figure 2. Effects of terrestrial protected areas on four local biodiversity measures.
(a) Species richness, (b) total abundance, (c) rarefied richness and (d) endemicity at sites inside (filled circles) relative to sites outside protected areas (open). Estimates are given separately for protected areas in different management category groups (grey circles; least restrictive (IUCN categories III–VI), unknown (missing IUCN category, potentially mixed set of categories) and most restrictive land management regimes (IUCN categories I and II)). Bars indicate 95% CIs; **P<0.01 and *P<0.05. Number of sampled sites in each category is shown; sample sizes vary between panels due to differences in the use of occurrence and abundance data to calculate biodiversity measures (see Supplementary Information). Separate generalized linear mixed effects models were run for each response variable (see Supplementary Information for further information). Supplementary Fig. 3 gives the corresponding results for analyses where sites were matched across the protected area boundary by land use.
Figure 3
Figure 3. Effects of protection on four biodiversity measures across eight land use types.
(ad) Sites outside (open circles) and inside (filled circles) protected areas in different land uses (colours: from left to right: primary vegetation; mature, intermediate and young secondary vegetation; plantation; cropland; pasture; urban). Error bars show 95% CIs. The number of sites in each type of land use and protection is given underneath each data point. Separate generalized linear mixed effects models were run for each response variable (see Supplementary Information for further information). Supplementary Fig. 2 gives corresponding analyses for taxonomic group, latitudinal zone and use intensity.
Figure 4
Figure 4. Effects of protected area age and size class on within-sample species richness.
The number of sites sampled outside and inside protected areas is given for each age and size combination. Effects were tested using a generalized linear mixed effects model with a Poisson error distribution (log link). See also Supplementary Fig. 4.

References

    1. Geldmann J. et al.. Effectiveness of terrestrial protected areas in reducing habitat loss and population declines. Biol. Conserv. 161, 230–238 (2013).
    1. Juffe-Bignoli D. et al.. Protected Planet Report 2014. Available at http://www.unep-wcmc.org/resources-and-data/protected-planet-report-2014 (UNEP-WCMC, 2014).
    1. CBD. Decision X/2, The strategic plan for biodiversity 2011–2020 and the Aichi Biodiversity Targets, Nagoya, Japan, 18 to 29 October 2010. Available at http://www.cbd.int/decision/cop/default.shtml?id=13164 (2010).
    1. Tittensor D. P. et al.. A mid-term analysis of progress toward international biodiversity targets. Science 346, 241–244 (2014). - PubMed
    1. Leverington F., Costa K. L., Pavese H., Lisle A. & Hockings M. A global analysis of protected area management effectiveness. Env. Manag. 46, 685–698 (2010). - PubMed

Publication types